Tetrad population guidance
Background
One of the most difficult tasks was to produce national population estimates for all species. These are in demand, for both winter and breeding season, to identify important areas for protecting birds and their habitats, for example through the designation of Ramsar sites, Special Protection Areas or Sites of Special Scientific Interest (Baker et al. 2006).
The calculation of national population estimates has never been an exact science, and we hoped with our work over the atlas survey period, that we would be transparent about how the national estimates have been derived and that the magnitude of error was clearly presented. That way, anyone using the national population estimates we derived will know exactly how they had been calculated for each species and can make their own judgement on how accurate they might be. If you look at previous national estimates, the ranges have been very large for some species eg Redstart 90,000 - 330,000 pairs, House Sparrow 2,600,000 - 4,600,000 pairs for Britain (Gibbons et al 1993) which certainly hints at the difficulty in producing these.
How population estimates are derived
We had at our disposal an array of information sources that could be combined with Atlas data to produce population estimates for birds in the breeding season and in winter. It was important for us to recognise the limitations of each survey/method and if necessary combine information from different sources.
The actual methods used depended on just how widespread the species is. This was reasonably straight-forward for those rare species whose entire breeding population is counted periodically by special surveys e.g. Red-necked Phalarope and Corncrake -where it is possible to gather an absolute count of birds in a specific year. We also worked closely with the Rare Breeding Birds Panel and exchanged information. There were also periodic counts of seabirds that we could draw on. For very common breeding species we could draw on density information from the Breeding Bird Survey and Countryside Bird Survey in the Republic of Ireland which when applied across the distribution from the Atlas gave us estimates. The difficulties arose for the breeding species that were not sufficiently often detected on BBS to derive meaningful density estimates. The BBS annual report lists those species which are recorded on fewer than 40 BBS squares, for example, Ring Ouzel, Little Ringed Plover and Water Rail (Risely et al 2008). Results from surveys outside the Atlas period gave us a handle on the total population at the time of the survey (e.g. National Ring Ouzel Survey in 1999).
During the winter, other than for a range of wetland birds counted by the Wetland Bird Survey, we had no systematic counts of species in Britain and Ireland. For example, for Lapwing in winter we have good counts of the numbers on wetlands from WeBS and IWeBS but we had no idea how many are on farmland as this habitat is not counted in WeBS. For some species, such as Waxwing, Crossbill and Quail there will be year to year variability to take into account. We hoped the Tetrad Population Estimates (TPE) would give us another strand of information to work with. Perhaps not on their own, but in conjunction with other data sources, they would really help us to produce population estimates for species for which we have never been able to make more than an educated guess.
So what does the Atlas tell us?
The Timed Tetrad Visits (TTVs) were designed to gather sufficient data to calculate relative abundance of species at the 10-km level. To help us with population estimates, we would have the counts for species from the TTVs. Nationally, we aimed to achieve coverage of at least eight tetrads in every 10-km square.
For example, in a TTV you do two visits and may record two Dunnocks on one visit and three Dunnocks on the second visit. We could either take an average across both visits, or more likely, take your maximum count across the two visits. If we did this for all eight tetrads covered, we would have the maximum number of Dunnock counted in eight tetrads and could multiply this up to the 10-km square and then add together all the maximum counts from every 10-km square. This would be an underestimate because your timed counts (one or two hours) aimed only to cover the main habitats and not the whole tetrad, and therefore wouldn’t count ALL the Dunnocks present.
The idea of the Tetrad Population Estimate was that the volunteer, given that they woudl have made one or two visits and will have a reasonably good idea of the habitats present in the tetrad, were in a much better position to have a go at working out the number of Dunnocks in the tetrad than someone who had never visited the tetrad. It was likely that the estimate from the volunteer would be broadly in the right area. If you counted a maximum of 3 singing Dunnocks on your breeding season TTV, and had covered about a quarter of the suitable habitat, you might assume that each of your three birds has a mate (you most likely record singing males in the breeding season) and then you could multiply your count by 4. You would come up with 24 birds, so a Tetrad Population Estimate of 30 seemed sensible. In this example, it is unlikely you would record 3 Dunnocks but actually think 100 were present. It was important to consider the detectability of each species and to take this into account. For a species like Dunnock, it was more detectable in the breeding season when it was singing, than in the winter when it was not.
Example
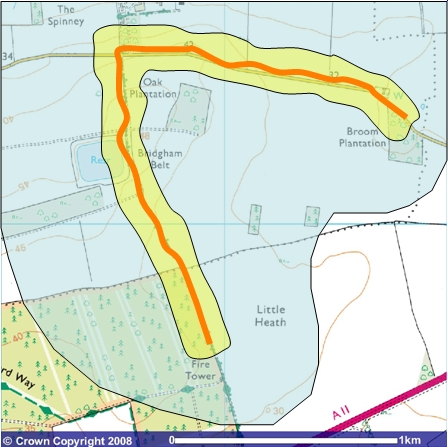
This tetrad (TL98P) was covered for two one-hour visits in the breeding season. The route walked on each visit is shown as an orange line and follows a road with substantial hedges either side and also follows a footpath towards the block of woodland in the south-west of the tetrad. The rest of the tetrad is mostly open farmland with good visibility across the flat fields. The mature coniferous forest plantation in the south-west corner is dense and most of the trees are covered in Ivy. Along the hedgerow it is likely that most of the species were detected but small birds in the middle of the field could have been missed, as were birds in the small patches of woodland. In the forest block, only birds audible from the path were detected. The likely detection distance for birds (especially songbirds) is about 50m either side of the route walked (shown approximately by yellow shaded area) although singing Skylarks could be detected across a wider area (shown approximately by blue shaded area)
On the early visit 30 Chaffinches were recorded (of which approximately 25 were singing males), and 14 were recorded on the late visit (of which approximately 10 were singing males). Given the route taken in the tetrad and habitat covered (good quality habitat for Chaffinches along the hedgerow), the habitat preferences of Chaffinch (hedges, woods) and the area of the tetrad not visited (mostly open farmland with no wooded boundary and the dense coniferous woodland), the TPE was estimated to be 100. This number was estimated by taking the highest count of singing males (25) and doubling to take into account females not detected (total = 50) and then doubling again to take into account the suitable habitat (for Chaffinch) not visited, which gives a total of 100. This may be an under-estimate or over-estimate of the real number but it is likely to be broadly correct.
For Skylark (where singing birds are readily detectable over a greater distance than Chaffinch) 16 were recorded on the early visit and 15 on the late visit and the TPE was estimated to be 40. This number was estimated by taking the maximum count of singing birds (16) and then doubling to take into account females (total = 32) and then adding a few more that may have been in the suitable habitat not covered in the south-east corner of the tetrad. It is likely this is still an under-estimate of the population of Skylarks in the tetrad as not all singing birds would have been detected on the visits. Nonetheless the TPE will be a useful guide.
Duplication and double-counting
Birds move between squares and there is potential to double count them in both locations. We must bear in mind however, that the opposite is equally likely – that the TTVs will occur such that the flock gets missed in both places. The best way to treat this problem was to count whatever you saw on the day you saw it, unless you knew for certain that the birds had moved from a tetrad you’ve already visited that day. Whilst this may have seemed counter-intuitive when looking at one’s own tetrads, when we looked at the national picture we had to assume that the “double-counting” and the “double-missing” balance each other out. This became increasingly important as we moved into the latter stages of the Atlas when observers were surveying tetrads they were unfamiliar with and could not second-guess what is normal for the tetrad. For these reasons our basic rule was to always count what you see on your visit and include these birds in your TPE. A few specifics for winter and breeding season, and some examples are detailed below.
General guidance
The TPE should have been based on what you saw during your TTVs or on your experience of the tetrad gained outside TTVs but within the atlas recording period (1 November 2007 – 31 July 2011) and the relevant season. For a handful of early/late nesting species breeding season TPEs could be based on observations outside April-July. These species included Goshawk, Crossbill and Long-eared Owl. TPEs were optional and you could enter them for some species but not others if you did not feel confident in doing so.
Guidance for the breeding season – birds using the tetrad not just breeding there
The TPE in the breeding season should have included birds present in the tetrad in the breeding season except juvenile birds of the year. Like the TTV counts, the TPE reflects the number of birds using the tetrad and not strictly just those actually breeding there. This is because for many species, even with good knowledge of a tetrad, it would have been difficult to work out how many you think are actually breeding. Furthermore, as fieldwork progressed and volunteers started visiting tetrads, and perhaps even 10-km squares they are unfamiliar with, the task of estimating which are breeding birds became even more difficult. In years three and four of atlas fieldwork, when we started organising expeditions, volunteers may have been visiting entirely unfamiliar areas. We think, therefore, that it was better to have a uniform approach to count everything you encountered.
Guidance for the winter
In winter, one of the main problems for fieldworkers is flocks of birds and what to count. In order to minimise double-counting, we suggested that if you see a flock of birds, for example Wigeon, move from one tetrad into another (and you were counting both tetrads for TTVs on the same day) then you only included the flock in the tetrad where you first encountered it and use that as a basis for that tetrad’s TPE.
If you were making TTV visits on different days to adjacent tetrads and you weren't sure if the same flock had moved or if you were seeing different birds, then you should have count them all and used that as the basis of your TPE.
We had already given guidance that coastal TTV counts should have been done at mid to high-tide whenever possible to facilitate counting and identification. Hence, including high-tide roosting waders in TPEs was permissible as it shouldn’t lead to duplication. However, if you were certain you hadn't already counted these individuals in a different tetrad, and in that tetrad’s TPE, then they could be ignored here.
A TPE should have included:
• Flocks of waders feeding on the shoreline as they are using the tetrad.
• Flocks of moulting geese as they are using the tetrad.
• Non-breeding immature gulls feeding on a landfill site, or foraging in pig fields.
• Swifts feeding over a field away from breeding habitat.
• Late Brent Geese encountered on an early TTV visit.
• Summering Grey Plovers or other waders.
A TPE should not include:
• Juvenile Starlings on a late breeding season visit.
• Birds at a dawn or dusk roost (TTVs should avoid these periods).
• A flock of Wigeon that has just moved from the tetrad you just surveyed.
• Flyovers of birds not using the square.
Summary
Tetrad Population Estimates were new for us too. However, experience in The Netherlands and Catalonia suggests that they may be useful for a number of species. In the Catalan Breeding Bird Atlas observers were asked to give an 'approximate and intuitive estimate' of birds per grid square and these figures were used where better data were absent. For those species where alternative data also existed, the observers' estimates were reassuringly similar.
We encouraged volunteers to have a go at producing TPEs for those species they felt able to, and appreciated from our own experience that they could be difficult.
It’s important to remember that the Atlas was concerned with the ‘big picture’ and that we had volunteers of varying skills, often visiting areas with no prior knowledge. It was particularly true of volunteers in Ireland and parts of Scotland who would be visiting areas unknown to them and will have had no benefit of local knowledge. The fieldwork methods and guidelines needed to be simple to follow. Whilst it would have been good to have species-specific guidelines, such an approach would not work on a project of this scale. The Atlas Working Group will be setting up a sub-group of specialists to concentrate on the methods for producing national population estimates.
References
Baker, H, Stroud, D.A., Aebischer N.J., Cranswick, P.A, Gregory, R.D, McSorley, C.A., Noble, D.G and Rehfisch, M.M. 2006. Population estimates of birds in Great Britain and the United Kingdom. British Birds 99: 25-44. www.britishbirds.co.uk/wp-content/uploads/2010/10/APEP21.pdf
Gibbons, D.W., Reid, J.B. & Chapman, R.A. (1993) The New Atlas of Breeding Birds in Britain and Ireland: 1988–1991. T. & A.D. Poyser, London.
Risely, K., Noble, D.G. & Baillie, S.R. 2008. The Breeding Bird Survey 2007. BTO Research Report 508. British Trust for Ornithology, Thetford.
Dawn Balmer & Simon Gillings
August 2008


Share this page