Preliminary report on the 2020 breeding season
The primary aim of BTO surveys is to monitor changes in the health of Britain’s birds, tracking declines and increases via the BTO/JNCC/RSPB Breeding Bird Survey and exploring the factors driving them through bird ringing and nest recording. The long-term trends in abundance, survival and breeding success generated by these schemes are presented on the BirdTrends webpages.
This report provides a preliminary assessment of the 2020 breeding season in terms of population sizes and breeding success, comparing this year’s results to the averages recorded over the previous five seasons.

How do we monitor the breeding season?
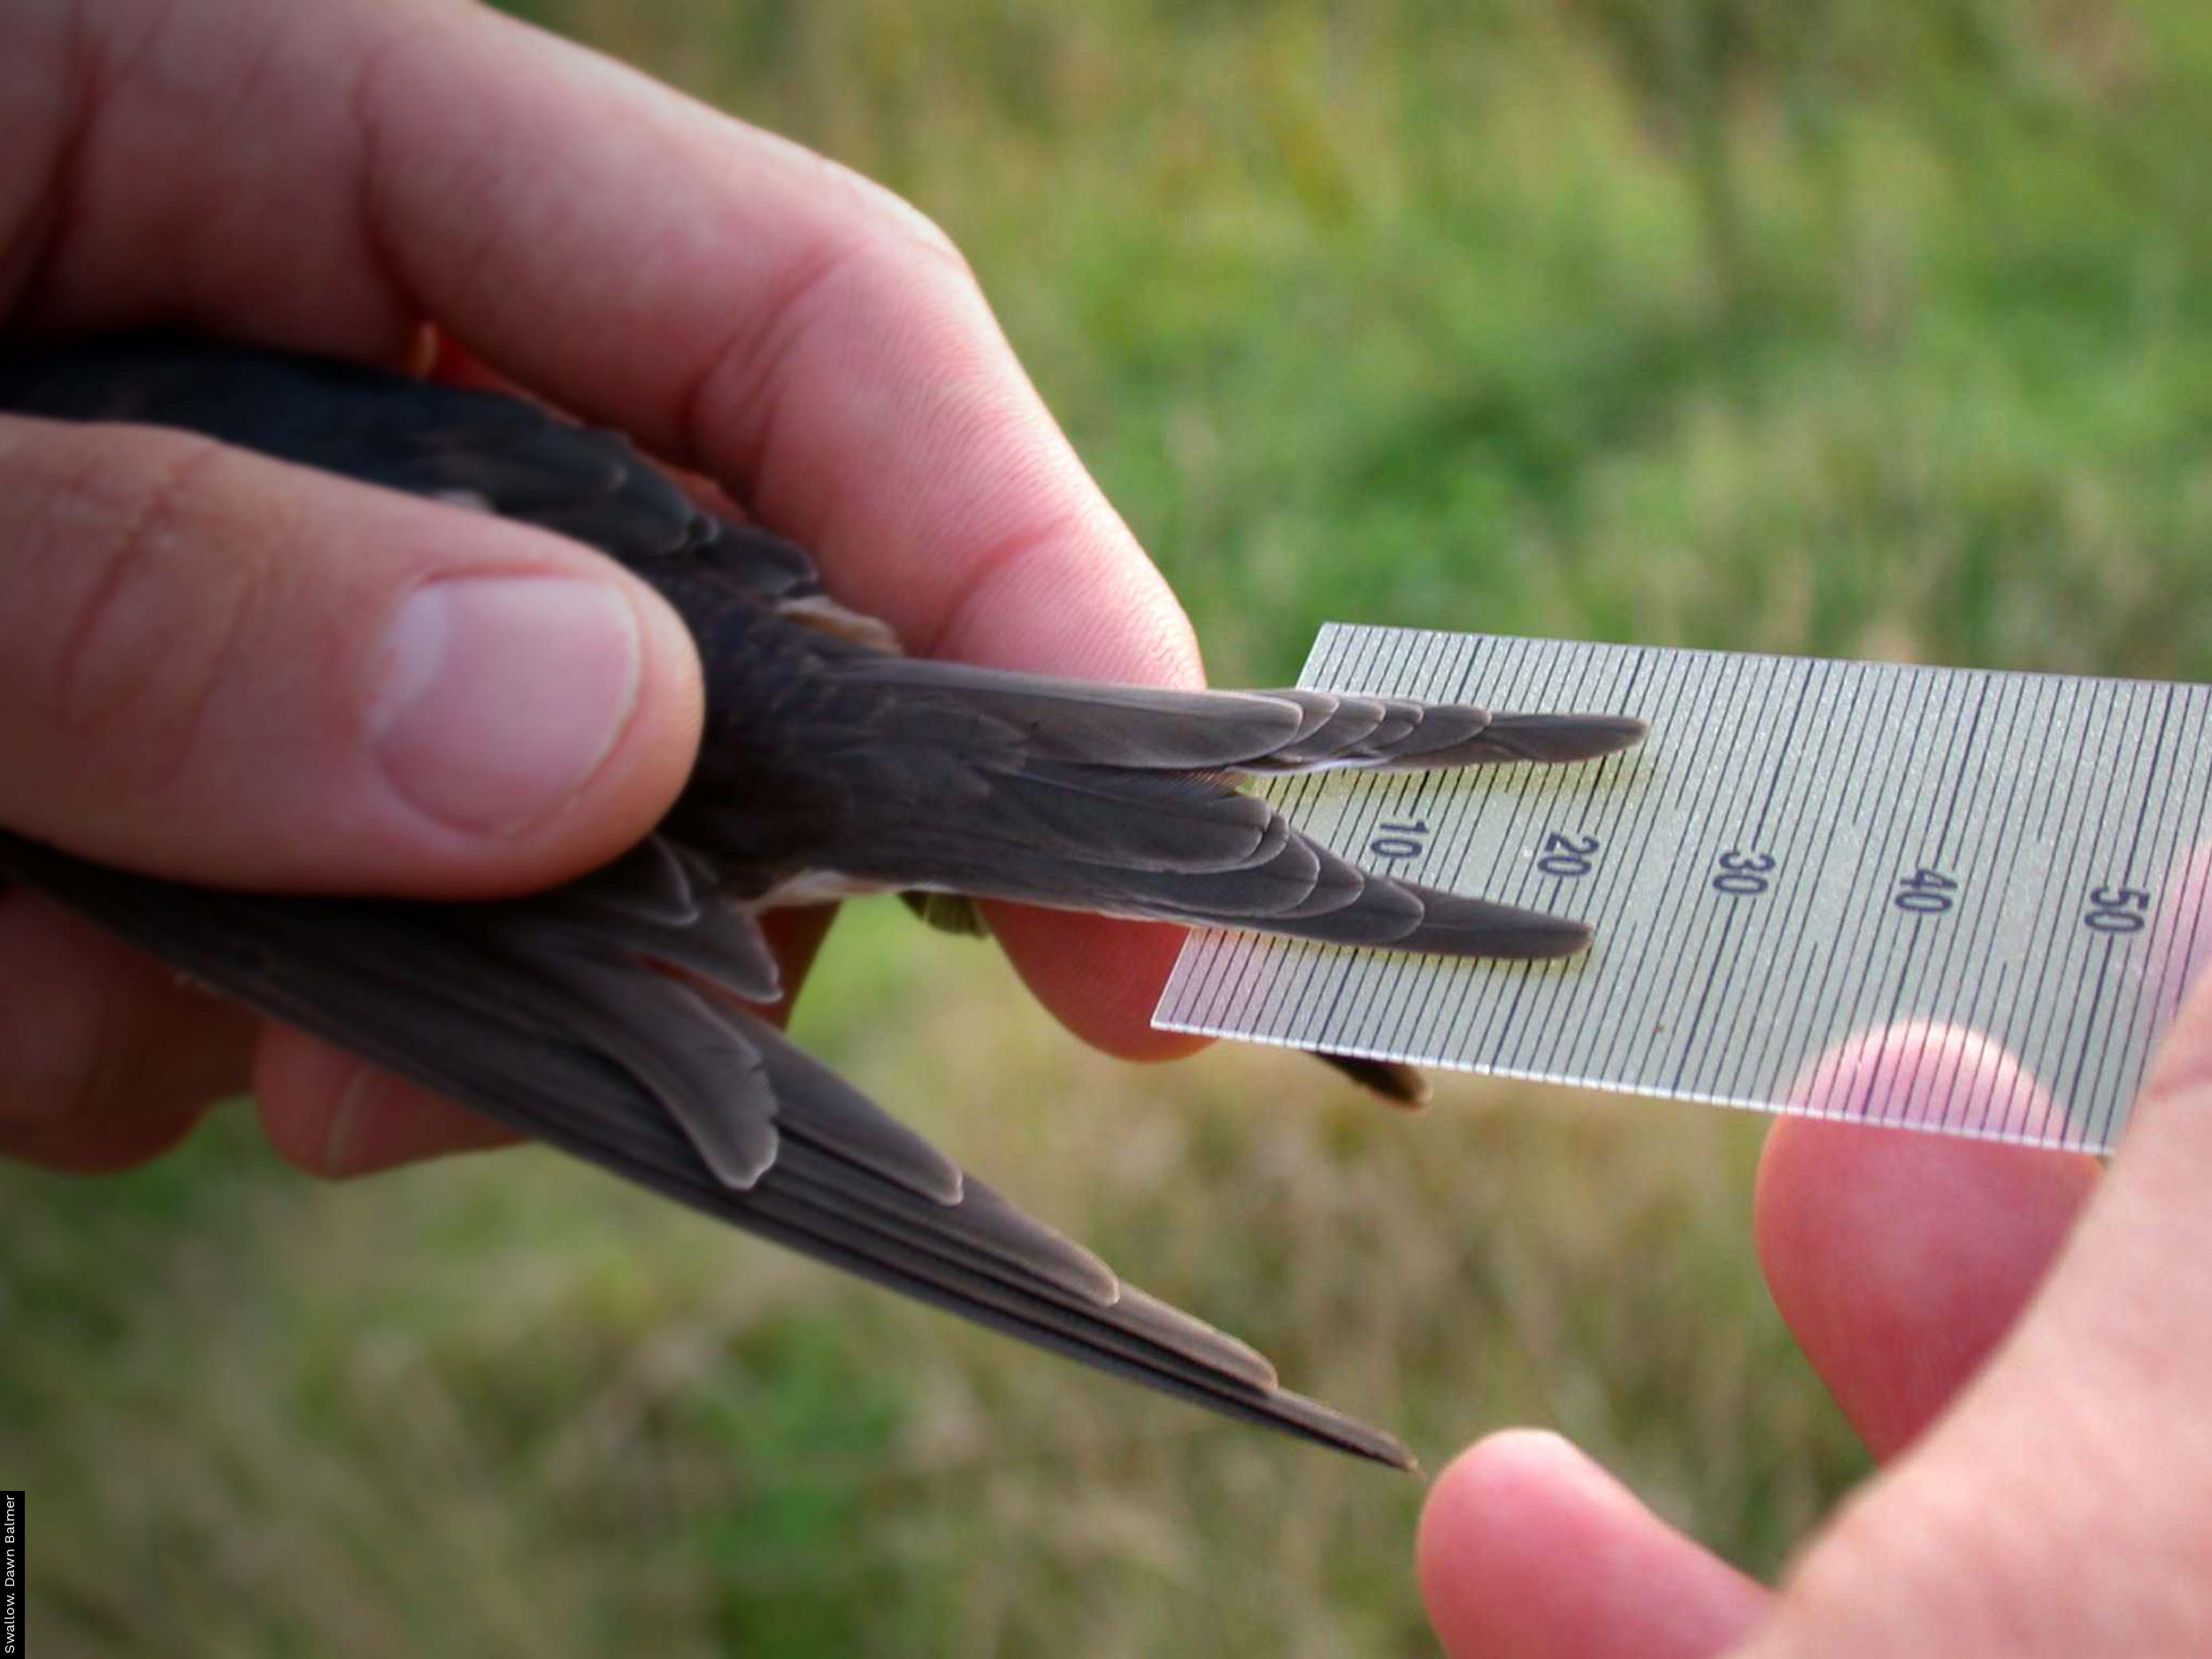
All of the data presented here are collected by BTO volunteer ringers and we are extremely grateful for their efforts, both in collecting the data and submitting it promptly. Numbers of adult birds are monitored by qualified bird ringers running a network of approximately 130 Constant Effort Sites (CES) across Britain & Ireland (107 in England, nine in Wales, eight in Scotland, five in the Republic of Ireland and one in Northern Ireland) between May and August. As their effort is standardised annually, the number of birds caught in each year provides an accurate measure of changes in abundance. Recaptures of birds ringed in previous years also allow survival rates to be calculated. The ratio of juvenile to adult birds caught on CESs provides a measure of breeding success that also takes into account the number of successful breeding attempts made per adult (as many species attempt to rear more than one brood per season) and the survival of young birds immediately after fledging.
CES covers 24 woodland, scrub and reedbed species. Not all of the CES data collected in 2020 have been received yet, so these results are based on a subset of sites for which we currently hold sufficient data to analyse.
What was the weather like in 2020?
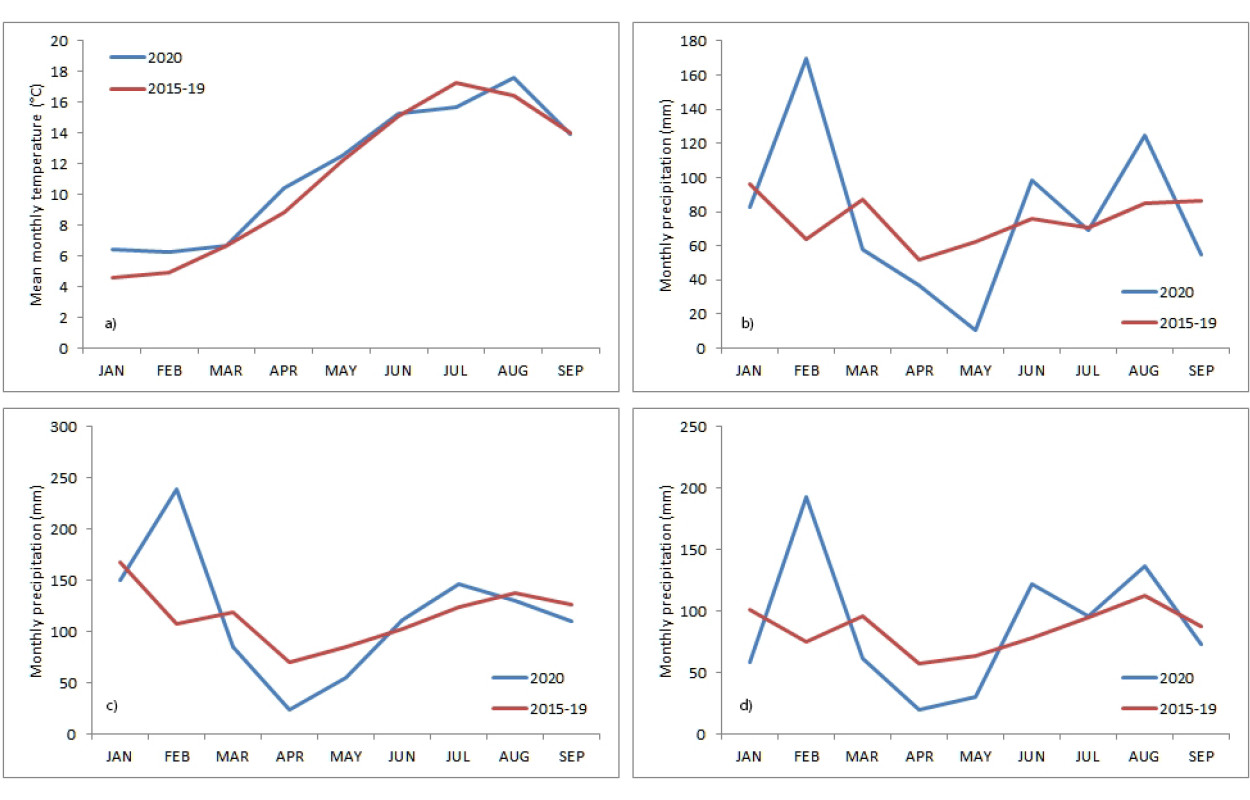
Winter 2019-20 were generally mild but unsettled, with particularly wet and stormy weather in February. It was classified as the fifth mildest winter since 1884 and the fifth wettest since 1862. By contrast, spring was much drier and sunnier than average (Figure 1a), with April being especially warm (provisionally the fifth warmest April since 1884), while summer was wet (Figures 1b-d) and unsettled with cooler spells, particularly in July.
The 2020 season
As a result of the Covid-19 pandemic, many CE sites were unable to operate in 2020; where ringing was possible, national lockdowns prevented most sites from completing their first, and sometimes second, visits at the start of May. The programs that calculate the CES trends are able to compensate for missed visits however, so this should not have affected the results. The majority of the 69 sites contributing data to the 2020 figures are located in England, and comparisons with results from previous years should take this spatial bias into account.
Migratory species
The abundance of four migrant species, Chiffchaff, Willow Warbler, Blackcap and Whitethroat, was significantly higher than the five-year mean (2015–19) and no migrant species displayed a significant reduction in numbers (Table 1). The largest increases were recorded for the short-distance migrants Chiffchaff (21%) and Blackcap (39%, Figure 2a), both of which were found to be more abundant than in any previous year since CES began in 1983. Neither species displayed significant increases in adult overwinter survival but Chiffchaff did experience a particularly productive breeding season in 2019, which may help to explain the 2020 figures. It is possible that higher juvenile survival contributed to the positive results for both species, and for the long-distance migrants Willow Warbler and Whitehroat, neither of which exhibited above average productivity in 2019 or over-winter survival, but this is a very challenging aspect of life history to measure. Young birds tend to disperse from the sites in which they were raised and are therefore less likely to be re-caught than adult birds, which generally return to the same breeding grounds each year; survival rates cannot be estimated if the probability of recapture of surviving individuals is too low. Most migrants experienced an average breeding season, the exception being Blackcap, which exhibited a significant decrease in productivity (13%) compared to the five-year mean, seemingly driven by results in the east.
Table 1. Adult abundance and breeding success calculated from 2020 CES data. Figures represent a percentage change relative to the five-year average (2015–19). Statistically significant (p < 0.05) positive and negative changes are highlighted in blue and red respectively. '*' denotes a small sample size.
|
Species |
Adult abundance change (%) |
Productivity change (%) |
Survival change (%) |
|
Migrant warblers |
|||
|
Chiffchaff |
21 |
-4 |
15 |
|
Willow Warbler |
14 |
-11 |
-1 |
|
Blackcap |
39 |
-13 |
-15 |
|
Garden Warbler |
12 |
-16 |
-25 |
|
Lesser Whitethroat* |
25 |
-11 |
-78 |
|
Whitethroat |
17 |
-6 |
-20 |
|
Sedge Warbler |
-8 |
-7 |
20 |
|
Reed Warbler |
-3 |
-3 |
13 |
|
Other residents |
|||
|
Cetti's Warbler* |
169 |
-20 |
- |
|
Treecreeper* |
23 |
-25 |
- |
|
Wren |
0 |
-4 |
11 |
|
Blackbird |
7 |
-17 |
-35 |
|
Song Thrush |
3 |
-34 |
63 |
|
Robin |
19 |
-11 |
42 |
|
Dunnock |
20 |
-19 |
26 |
|
Chaffinch |
-34 |
11 |
11 |
|
Greenfinch |
-31 |
8 |
- |
|
Goldfinch |
16 |
-27 |
- |
|
Bullfinch |
37 |
-27 |
52 |
|
Reed Bunting |
15 |
-23 |
-9 |
|
Resident tits |
|||
|
Blue Tit |
61 |
-55 |
-14 |
|
Great Tit |
20 |
-39 |
-20 |
|
Willow Tit* |
-60 |
1 |
- |
|
Long-tailed Tit |
-4 |
-19 |
-27 |
Resident species
For most resident species, 2020 was a much more positive year than 2019 in terms of abundance (Table 1), with six species exhibiting significant increases and only two displaying significant decreases with respect to the five-year mean (2015–19). The largest increases were observed for Cetti’s Warbler, Blue Tit and Bullfinch, all of which, along with Treecreeper and Goldfinch, were recorded in greater numbers than in any previous CES season; numbers of Great Tit, Robin and Dunnock were also above average. For Bullfinch, significantly higher rates of adult overwinter survival may have increased numbers; in contrast, the greater abundance of Blue Tit, Robin and Dunnock was more likely to be associated with juvenile recruitment as all three recorded above average breeding success in 2019. The mechanism for the increase in Cetti’s Warbler and Great Tit numbers is less clear, although all species may have benefited from higher juvenile survival over the preceding mild winter.
Chaffinch and Greenfinch continue to decline significantly and both species were recorded in lower numbers in 2020 than in any previous year through CES; these results mirror the trends generated by BBS, which show alarming declines for both species since the late 2000s / early 2010s, thought to relate to the prevalence of Trichomoniasis.

As with migrant species, 2020 proved to be a poor breeding season for resident species, with five species (Blue and Great Tit, Song Thrush, Dunnock and Bullfinch) displaying below average productivity and none registering significant increases. The hardest hit species were Blue and Great Tit, which exhibited 55% (Figure 2b) and 39% declines respectively, resulting in the lowest productivity estimates since CES monitoring began; this may well explain the reduction in numbers recorded by BTO Garden BirdWatchers during the summer. It is possible that the above average abundance of four of these species during 2020 resulted in increased competition for resources between pairs, reducing fledging success. Alternatively, the results may be due to phonological disjunction, the warm April temperatures advancing the emergence of caterpillars to a greater degree than it advanced egg laying, resulting in mismatches and reduced food availability at the nestling stage.

Join us in monitoring birds in 2020
If you are a qualified ringer with access to an area of scrub, woodland or reedbed where there is the potential to catch at least 250 birds per season, why not register a CES? And if you aren’t able to start your own site, why not consider helping out at an existing one? Contact the CES Organiser for more information.
Acknowledgements
We are extremely grateful to all Constant Effort Site ringers for their monitoring efforts and for the support of the BTO/JNCC partnership, which the JNCC undertakes on behalf of the Country Agencies. Additional funding for the BTO Ringing Scheme is provided by the National Parks and Wildlife Service (Ireland) and the ringers themselves. The Breeding Bird Survey is run by the BTO and jointly funded by the BTO, the JNCC and the RSPB. The Garden BirdWatch survey is run by the BTO and funded by the participants.


Share this page