Bird ringing generates information on the survival, productivity and movements of birds, helping us to understand why populations are changing.
Please report ringed birds to us using the Euring app.
Scheme participants can view and enter data in the online portal (DemOn).

Time, skill and support
It usually takes a year or more, ringing regularly with qualified ringers, to obtain a ringing permit.
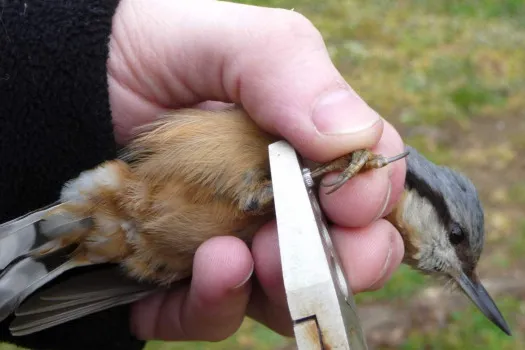
Basic bird identification skills and reasonable dexterity are required e.g. to use rulers and pliers.
Ringing trainees receive instruction from ringing trainers and other qualified ringers.
About the ringing scheme

The benefit of ringing data
Ringing data make a major contribution to the study of population changes and to our understanding of species declines. Bird populations are determined by the number of fledglings raised and the survival of both juveniles and adults.
- You can report a ringed bird to us using the Euring app.
Combining data sets
Whilst ringers collect data on survival, volunteers for the Nest Record Scheme collect information on productivity. The results can be analysed in combination with population trend data, such as that collected through the BTO/JNCC/RSPB Breeding Bird Survey, to determine at which stage of a bird’s life cycle there might be a problem. This enables scientists and conservationists to target appropriate mitigation measures.
All records of ringed birds are valuable
- Find out more about why you should report a ringed bird and how.
Taking part
If you want to become a bird ringer, you need to find a ringing trainer, who will be able to assess whether you can obtain a training permit.
Code of Conduct
Volunteers must follow BTO’s Code of Conduct. This code applies to our staff, our members, and volunteers, including surveyors and participants in the Ringing and Nest Record Schemes, (hereafter referred to collectively as ‘staff and supporters’). It applies to all BTO activities, whether online (including meetings and events, telephone, letter, and email) or offline (any face-to-face interaction). We've also written some guidance for volunteer fieldworkers, which will help beginners in particular.
Recent updates
Buy rings and other equipment
Project team
Follow this project
Contact
- ringing@bto.org
Project timeline
- 1909 Ringing began in Britain & Ireland
- 1937 BTO took over running of the Ringing Scheme
- 1957 Ringers’ Bulletin launched
- 1965 First edition of the Ringers’ Manual published
- 1975 Ringing & Migration journal first published
- 1983 Constant Effort Scheme (CES) launched
- 1998 Retrapping Adults for Survival (RAS) Scheme launched
- 2006 Launch of the Online Ringing & Nest Recording Report
- 2015 Launch of LifeCycle magazine
- 2017 Launch of Demography Online (DemOn)
- 2020 Launch of Garden CES
Contributions and findings
- Winter wren populations show adaptation to local climate
- Flexibility in the timing of post-breeding moult in British passerines
- Latitudinal gradients in the productivity of European migrant warblers have not shifted northwards during a period of climate change
- Integrating demographic data: towards a framework for monitoring wildlife populations at large spatial scales
Ringing surveys
Two long-term ringing surveys allow us to collect more detailed data on survival and productivity: the Constant Effort Site Scheme and the Retrapping Adults for Survival Scheme.

Online Ringing & Nest Recording Report
The Ringing Report provides information on the numbers of birds ringed, and reports of ringed birds received (recoveries), for the whole Ringing Scheme.

LifeCycle magazine
LifeCycle is the magazine of the British and Irish Ringing Scheme and the Nest Record Scheme (NRS), published twice a year, in the spring and autumn.

About ringing
Ringing generates information on the survival, productivity and movements of birds, helping us to understand why populations are changing.
Training to ring
If you want to become a bird ringer, you need to find a ringing trainer and obtain a ringing permit. All ringers start out as Trainees and hold a T-Permit.

Resources for ringers
Information about data collection and biometrics, opportunities, health and safety, and social media. You can also find links to the Ringing Sales shop.


