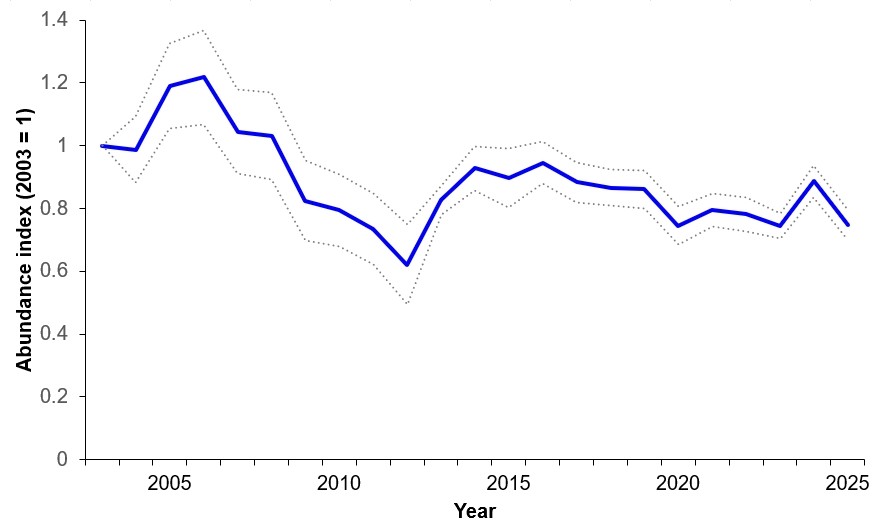
Annual roding counts 2003-2025
Thanks to a growing group of dedicated volunteers, we have good data on the number of roding Woodcock from a sub-sample of national survey squares across Britain and Ireland. However, the breeding population is still in long-term decline with now 35% fewer compared to 2003, so annual counts are vital to monitor ongoing population change.
Data were submitted for an impressive 350 sites in 2025, substantially above the 150-site average coverage achieved before 2023. Once again, this high number is largely due to the many new participants that took part in the national Breeding Woodcock Survey in 2023, and who have continued to survey their chosen site in 2025.
Broadly, overall numbers have declined at the monitored sites over the past two decades. The 2025 annual monitoring survey results showed the average count had dropped back to the levels recorded between 2020 and 2023. This suggests the isolated increase in 2024 may have been the result of a relatively favourable breeding season in 2023. Conversely, decreased roding activity resulting from reduced feeding opportunities and breeding productivity observed in the exceptionally dry spring and summer of 2025 appears to have cancelled out any short-term gains in 2024.
The national survey, in 2023, found that, despite there being an 8% decline overall since 2013, most regions in England and Southern Scotland had seen small increases in Woodcock numbers. The national decline had been driven solely by a substantial 50% decrease in northern Scotland.
Annual monitoring squares represent relatively few sites in northern Scotland, and we would particularly encourage new surveyors in northern Scotland to get involved. If there are no random sites close to you, please contact us about setting up self-selected sites in northern Scotland, as these are still valuable.
Fig. 1. Annual woodcock population index 2003-25 (grey dashed lines = 95% confidence limits).
Results of the 2023 national survey
The 2023 survey revealed a UK population estimate of 51,687 males and a British population estimate of 50,750 males. The Northern Ireland population estimate was 937 males. The British population had declined by 8% since 2013, but by 35% since 2003. There were long-term declines in all survey regions apart from northern England.
We anticipated a general downward trend from our annual monitoring. However, the abrupt decline of 31.3% in Scotland since 2013 was quite unexpected, and more startling was the disconcerting 49.5% decline in northern Scotland since 2013. More encouragingly, Woodcock numbers had increased since 2013 in eight of the 11 British survey regions. Surprisingly, England and Wales had experienced population increases, of 19.4% and 24.5% respectively, during this period.
2023 national population estimates and comparative change, since 2003 and 2013
| Region | 2023 population estimate | Change 2003 to 2023 | Change 2013 to 2023 |
| England | 28,940 | -22.5 % | +19.4 % |
| Scotland | 20,673 | -47.3 % | -31.3 % |
| Wales | 1,138 | -35.6 % | +24.5 % |
| Northern Ireland | 937 |
|
|
| Britain | 50,750 | -35.2 % | -8.1 % |
The overall rate of population decline slowed between 2013 and 2023 compared to between 2003 and 2013. However, the UK population overall had dropped by more than a third in just two decades and was continuing to fall despite some modest short term regional increases. The long-term decline remains a cause for concern, and especially that in northern Scotland. Scotland has historically supported the core of the breeding Woodcock population, so losses here will naturally have a greater impact on the overall UK population compared with other regions, cancelling out modest gains elsewhere.
This was the third large-scale survey of breeding Woodcock (2003, 2013, 2023) and was the biggest and most comprehensive yet. A total of 1,192 randomly selected 1-km survey squares was visited throughout the Britain in 2023. This represented an impressive 43% increase in sample size compared to 2013. Survey efforts in Northern Ireland resulted in data for 38 squares, allowing us to produce the first complete Woodcock population estimate for the entire UK.
Regional population change 2003–23

Future work
The cause of the ongoing UK population decline and the sharp reduction in northern Scotland since 2013 is not clear. There are likely to be several contributing factors, potentially involving nesting habitat suitability and availability, breeding productivity and winter mortality. We will continue short-term monitoring via our annual surveys, which will provide early warning of any further changes. The 2023 survey results will be key for informing the current review of national conservation policies and actions required to secure the future of this species in the UK.
- It is possible that weather has an influence on annual fluctuations in Woodcock numbers.
- Heavy rain and low temperatures in April and early May might result in higher chick mortality.
- In winter, low temperatures and lying snow will reduce food accessibility and could increase Woodcock mortality.
Given the general declining trend, which may involve factors in addition to weather, it is essential that we continue to count at least 100 sites per year in order to monitor future change more closely.
Woodcock Survey publications
- The results of the 2023 national survey including the population changes from previous national surveys in 2003 and 2013.
- The results of the 2013 national survey, examining changes in population size and distribution since 2003.
- Exploring the effects of habitat and landscape upon Woodcock breeding abundance.