Read reviews of the books we hold in the Chris Mead Library, written by our in-house experts. A selection of book reviews also features in our members’ magazine, BTO News.
Featured review
All the Birds of the World
Lynx have had a long-term project to produce an exhaustive guide to the birds of the world. It started out with the 17 volumes of the Handbook of the Birds of the World (1992–2013) which has family and species accounts for all birds. This was followed by the two volumes of the Illustrated Checklist of the Birds of the World (2014–2016). They have now published the third and final stage of this avian odyssey with this current book.

Search settings
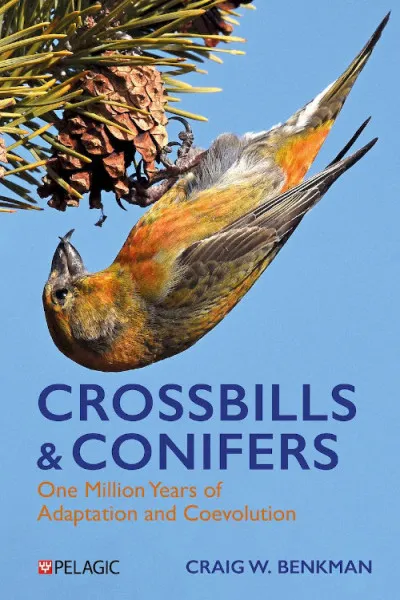
Crossbills & Conifers: One Million Years of Adaptation and Coevolution
Author: Craig W. Benkman
Publisher: Pelagic Publishing, Exeter
Published: 2025
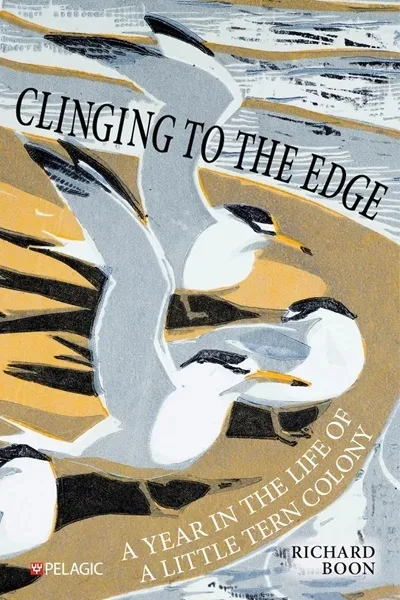
Clinging to the Edge: A Year in the Life of a Little Tern Colony
Author: Richard Boon
Publisher: Pelagic Publishing, Exeter
Published: 2024
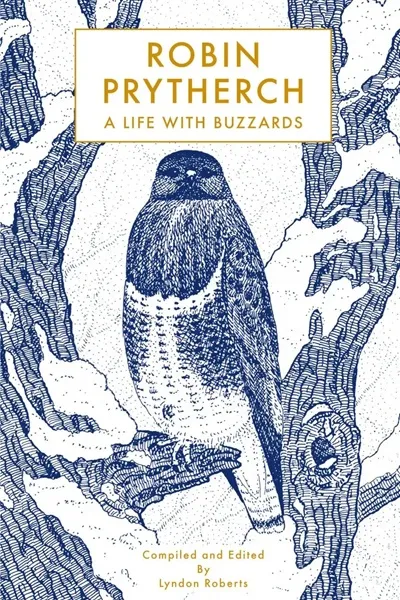
Robin Prytherch: A Life with Buzzards
Author: Robin Prytherch and Lyndon Roberts (ed.)
Publisher: Bristol Books, Bristol
Published: 2024
Encounters with Corvids
Author: Fionn Ó Marcaigh (author), Aga Grandowicz (illustrator)
Publisher: Natural World Publishing, Dublin
Published: 2025
Endemic: Exploring the Wildlife Unique to Britain
Author: James Harding-Morris
Publisher: Bloomsbury Publishing, London
Published: 2025
Land Beneath the Waves
Author: Nic Wilson
Publisher: Summersdale Publishers, Chichester
Published: 2025
Bird School: A Beginner in the Wood
Author: Adam Nicolson
Publisher: William Collins, London
Published: 2025
The Cuckoo’s Lea: The Forgotten History of Birds and Place
Author: Michael J. Warren
Publisher: Bloomsbury Publishing, London
Published: 2025
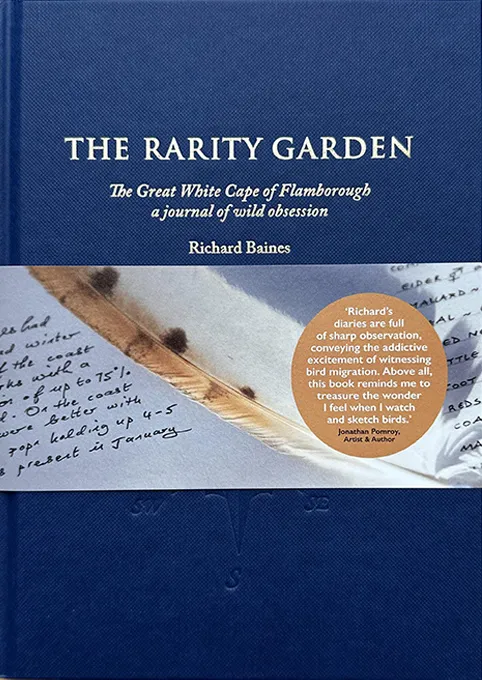
The Rarity Garden: The Great White Cape of Flamborough
Author: Richard Baines
Publisher: Yorkshire Coast Nature
Published: 2025