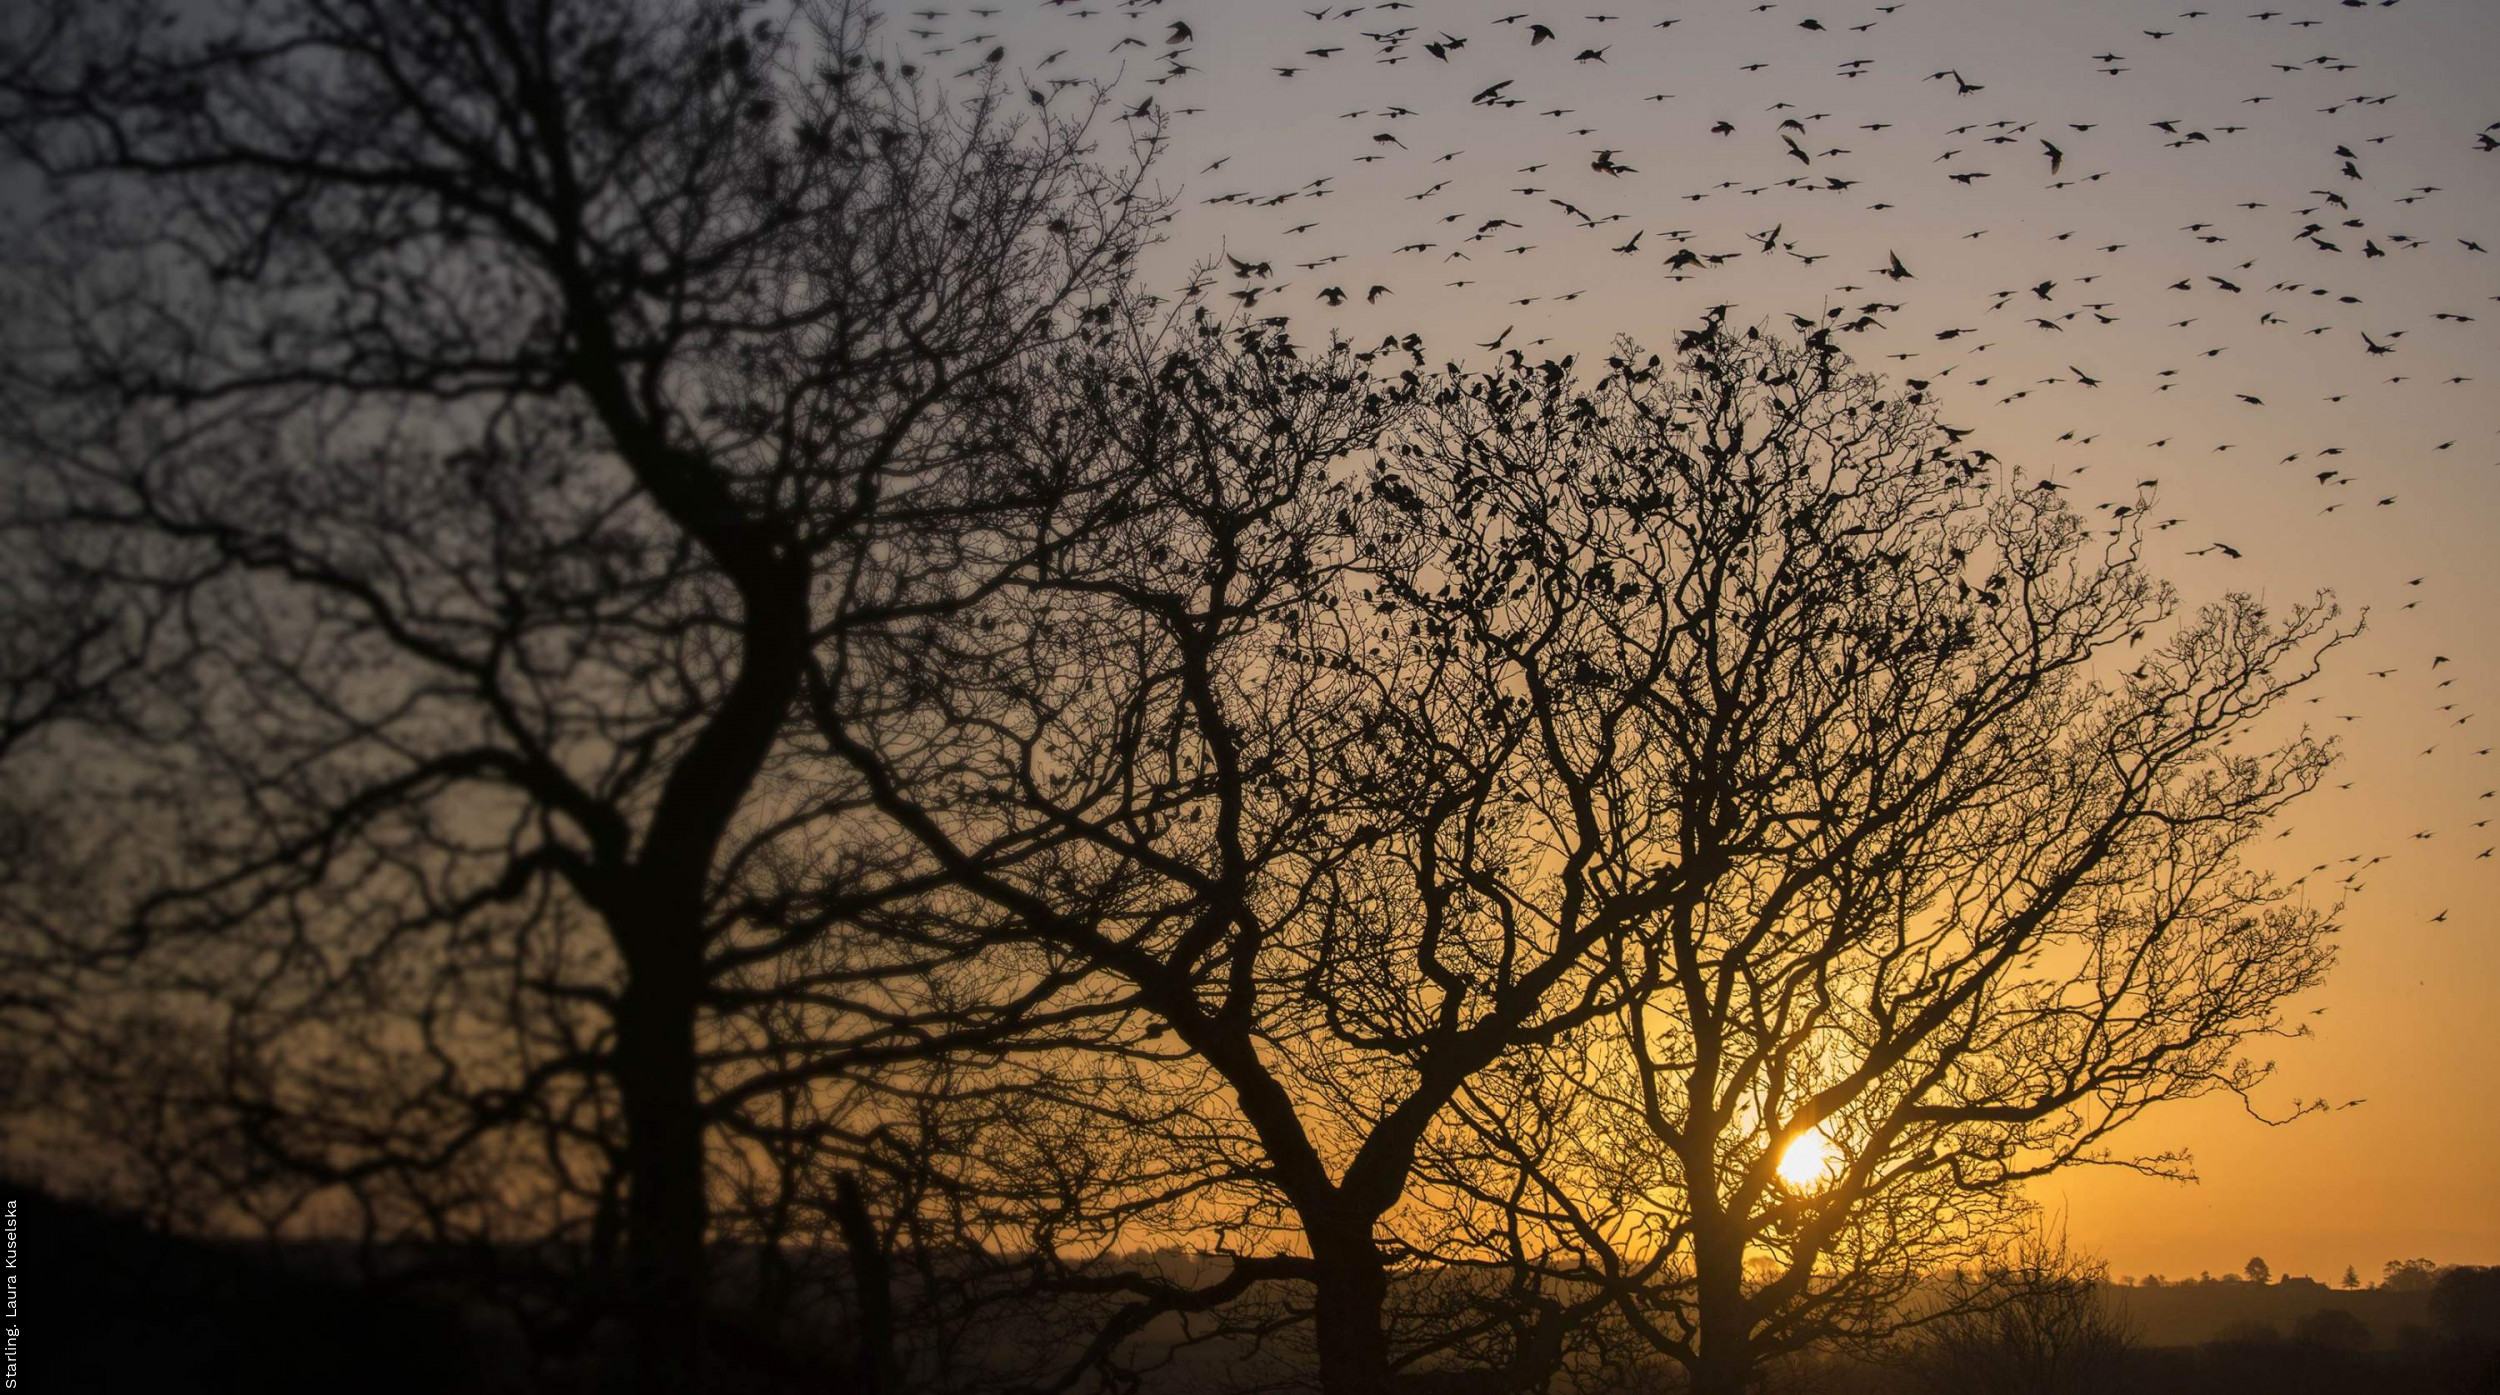
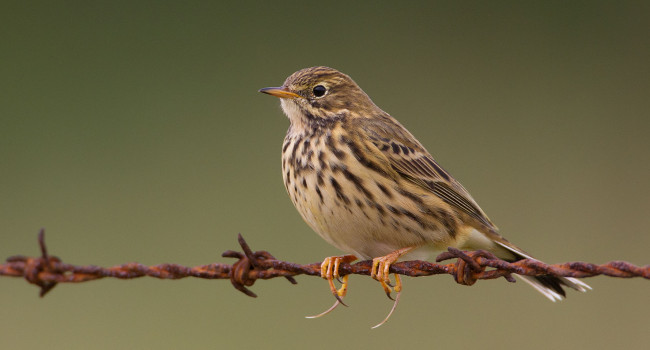
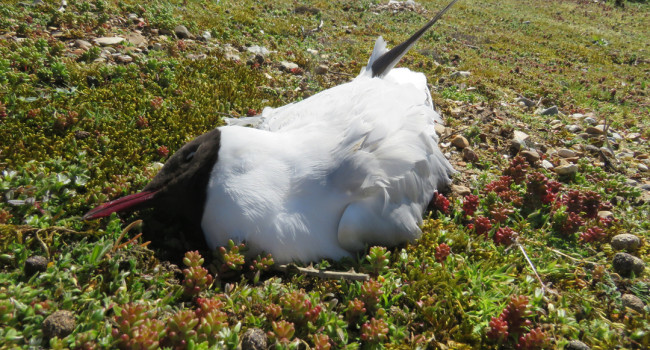
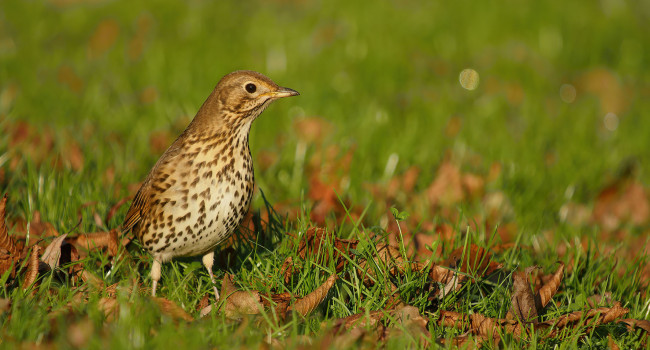
- CES adults alerts – long term
- CES adults alerts – 25 years
- CES adults alerts – 10 years
- CES adults alerts – 5 years
- CES adults population increases of >50% – long term
1. Table of alerts for CES adults 1984-2016
Species
Period
(yrs)
Plots
(n)
Change
(%)
Lower
limit
Upper
limit
Alert
Comment
Willow Warbler
32
89
-74
-80
-67
>50
Willow Tit
32
16
-68
-88
-33
>50
Small sample
Lesser Whitethroat
32
37
-66
-84
-49
>50
Reed Bunting
32
60
-60
-72
-48
>50
Whitethroat
32
64
-49
-63
-25
>25
Sedge Warbler
32
67
-46
-61
-31
>25
1. Table of alerts for CES adults 1984-2016 |
Species | Period (yrs) |
Plots (n) |
Change (%) |
Lower limit |
Upper limit |
Alert | Comment |
---|---|---|---|---|---|---|---|
Willow Warbler | 32 | 89 | -74 | -80 | -67 | >50 | |
Willow Tit | 32 | 16 | -68 | -88 | -33 | >50 | Small sample |
Lesser Whitethroat | 32 | 37 | -66 | -84 | -49 | >50 | |
Reed Bunting | 32 | 60 | -60 | -72 | -48 | >50 | |
Whitethroat | 32 | 64 | -49 | -63 | -25 | >25 | |
Sedge Warbler | 32 | 67 | -46 | -61 | -31 | >25 |
2. Table of alerts for CES adults 1991-2016
Species
Period
(yrs)
Plots
(n)
Change
(%)
Lower
limit
Upper
limit
Alert
Comment
Lesser Whitethroat
25
39
-70
-81
-59
>50
Willow Warbler
25
96
-67
-72
-61
>50
Willow Tit
25
15
-65
-88
-29
>50
Small sample
Greenfinch
25
44
-63
-81
-45
>50
Sedge Warbler
25
75
-52
-61
-45
>50
Reed Bunting
25
66
-46
-61
-30
>25
Chaffinch
25
84
-42
-58
-26
>25
Whitethroat
25
72
-40
-56
-13
>25
2. Table of alerts for CES adults 1991-2016 |
Species | Period (yrs) |
Plots (n) |
Change (%) |
Lower limit |
Upper limit |
Alert | Comment |
---|---|---|---|---|---|---|---|
Lesser Whitethroat | 25 | 39 | -70 | -81 | -59 | >50 | |
Willow Warbler | 25 | 96 | -67 | -72 | -61 | >50 | |
Willow Tit | 25 | 15 | -65 | -88 | -29 | >50 | Small sample |
Greenfinch | 25 | 44 | -63 | -81 | -45 | >50 | |
Sedge Warbler | 25 | 75 | -52 | -61 | -45 | >50 | |
Reed Bunting | 25 | 66 | -46 | -61 | -30 | >25 | |
Chaffinch | 25 | 84 | -42 | -58 | -26 | >25 | |
Whitethroat | 25 | 72 | -40 | -56 | -13 | >25 |
3. Table of alerts for CES adults 2006-2016
Species
Period
(yrs)
Plots
(n)
Change
(%)
Lower
limit
Upper
limit
Alert
Comment
Greenfinch
10
41
-68
-76
-58
>50
Chaffinch
10
77
-49
-57
-43
>25
Lesser Whitethroat
10
34
-27
-43
-6
>25
3. Table of alerts for CES adults 2006-2016 |
Species | Period (yrs) |
Plots (n) |
Change (%) |
Lower limit |
Upper limit |
Alert | Comment |
---|---|---|---|---|---|---|---|
Greenfinch | 10 | 41 | -68 | -76 | -58 | >50 | |
Chaffinch | 10 | 77 | -49 | -57 | -43 | >25 | |
Lesser Whitethroat | 10 | 34 | -27 | -43 | -6 | >25 |
4. Table of alerts for CES adults 2011-2016
Species
Period
(yrs)
Plots
(n)
Change
(%)
Lower
limit
Upper
limit
Alert
Comment
Greenfinch
5
36
-49
-63
-36
>25
Whitethroat
5
81
-38
-47
-29
>25
Chaffinch
5
75
-30
-40
-23
>25
4. Table of alerts for CES adults 2011-2016 |
Species | Period (yrs) |
Plots (n) |
Change (%) |
Lower limit |
Upper limit |
Alert | Comment |
---|---|---|---|---|---|---|---|
Greenfinch | 5 | 36 | -49 | -63 | -36 | >25 | |
Whitethroat | 5 | 81 | -38 | -47 | -29 | >25 | |
Chaffinch | 5 | 75 | -30 | -40 | -23 | >25 |
5. Table of population increases for CES adults 1984-2016
Species
Period
(yrs)
Plots
(n)
Change
(%)
Lower
limit
Upper
limit
Alert
Comment
Goldfinch
32
35
65
8
249
Robin
32
95
71
41
112
Wren
32
102
87
59
128
Blackcap
32
94
116
79
167
Chiffchaff
32
78
338
165
681
5. Table of population increases for CES adults 1984-2016 |
Species | Period (yrs) |
Plots (n) |
Change (%) |
Lower limit |
Upper limit |
Alert | Comment |
---|---|---|---|---|---|---|---|
Goldfinch | 32 | 35 | 65 | 8 | 249 | ||
Robin | 32 | 95 | 71 | 41 | 112 | ||
Wren | 32 | 102 | 87 | 59 | 128 | ||
Blackcap | 32 | 94 | 116 | 79 | 167 | ||
Chiffchaff | 32 | 78 | 338 | 165 | 681 |