Mammal recording was introduced to the Breeding Bird Survey in 1995 with a view to helping improve our knowledge of the distribution and population trends of some of our commoner mammals.

Compared with birds, the population trends of mammals are relatively poorly known. Even though mammal recording has always been a voluntary addition to the scheme, around 90% of BBS squares now hold mammal data.
- Download the instructions for monitoring mammals on BBS.
- Download the latest results of BBS mammal monitoring.
Mammal trends to 2024
BBS count data are used to calculate population trends for nine relatively widespread mammal species, shown below. These trends cover the period 1995–2024.
- Mammal data were recorded on 87% of the 3,967 BBS squares surveyed, including zero counts.
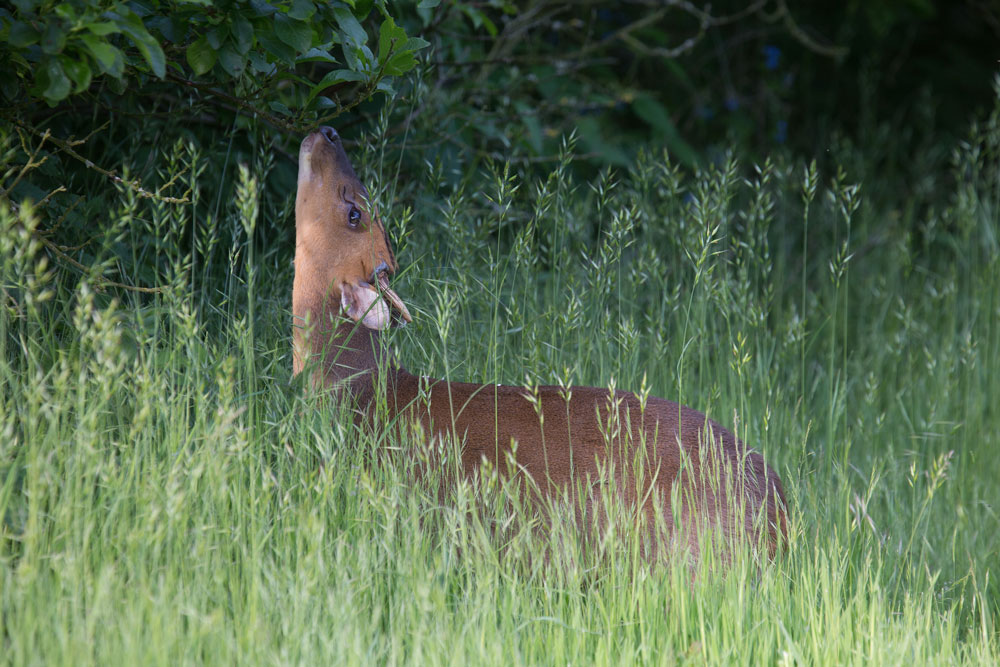
- Forty-two species of mammal were recorded in one form or another during the 2024 field season. These might be observations of live animals (counts), field signs, roadkill/dead animals, or local knowledge. This includes common, widespread and easy-to-see species such as Roe Deer, to rare or cryptic species like the European Beaver.
Of the nine mammals for which trends can be produced from BBS counts, five have increased significantly in the UK as a whole since 1995:
- Brown Hare (35%)
- Grey Squirrel (20%)
- Reeves’ Muntjac (321%)
- Red Deer (105%)
- Roe Deer (117%)
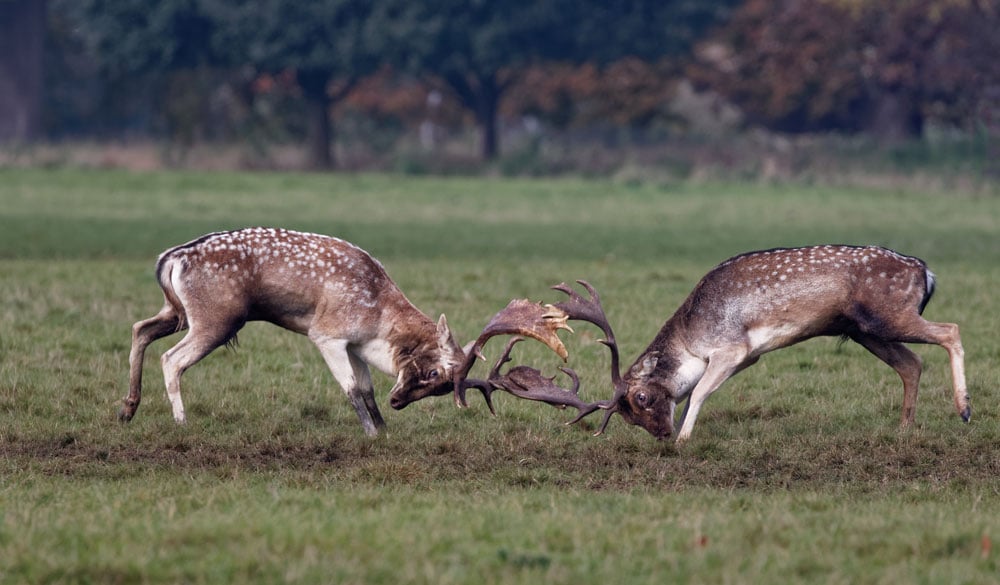
The increase in deer numbers has been documented in the BBS report for a number of years. Some of these increases continue, or have even accelerated in recent years, with Red Deer (67%), Fallow Deer (130%), Roe Deer (20%) and Reeves’ Muntjac (61%) all increasing in the last five years.
The increase in deer numbers, not just of species monitored by BBS, but also of Sika Deer, has led to the introduction of trial deer-culling incentive schemes in two regions of Scotland. Introduced by NatureScot in August 2024, these schemes aim to increase deer culling in Central Belt and Highlands by providing financial incentives to landowners, who currently pay for culls out of their own pocket.
It should be noted that trends for herding species (Red Deer and Fallow Deer) should be treated with some caution. This is because the presence or absence of a herd in a given BBS visit could heavily influence the overall trend for that species.
Three mammals have declined significantly across the UK:
- Rabbit (72%)
- Mountain/Irish Hare (64%)
- Red Fox (52%)
In the case of Rabbit, 2024 represents the fourth consecutive year in which the unsmoothed index has declined, following two and half decades of steady decline, with numbers now estimated to be one fifth of what they were in 1996. Two strains of Rabbit Haemorrhagic Disease (RHD) have led to Rabbit population declines in the UK and in other parts of Europe.
- More information on the mammals recorded during the 2024 BBS surveys can be seen on pages 30-31 of the latest Breeding Bird Survey report.
The information on species detected more often by signs of their presence than by sightings (e.g. Hedgehog, Mole and Badger) can also be used to estimate trends, although these require more careful interpretation.
Download the results from the latest mammal trends
Comparison of BBS mammal trends with the National Gamebag Census
In 2011 the JNCC funded work to compare BBS mammal trends between 1995 and 2009 with another annual scheme: the National Gamebag Census (NGC), carried out by the Game and Wildlife Conservation Trust. The NGC is a voluntary scheme that collects bag statistics from shooting estates, on average about 650 per year. The aim of the project was to produce an overview of trends in abundance and distribution.
Of nine species tested, none differed significantly in their trends between the two schemes. For four species where BBS indicated significant increases between 1995 and 2009, the NCG trend was either not significant (Red Deer, Roe Deer and Reeves’ Muntjac) or also showed a significant increase (Grey Squirrel). Rabbit showed a significant decline in BBS whereas NGC found no significant change.
This work demonstrated the feasibility of producing joint BBS-NGC trends for assessing population change for statutory purposes where a single figure is needed. Results of the spatial mapping were also useful, in showing areas where species are most often detected and where the most marked changes had occurred. However, due to differences in sampling design and methods, the recommendation is to routinely report temporal and spatial results from the two schemes separately.

