
WeBS Core Data example
WeBS Core data can be provided as either Monthly Counts or a Tabulated Five-year Synopsis, for further details please refer to the
guidance notes
guidance notes (DOC, 157.00 KB)
.
guidance notes
Monthly data
These are provided in a .csv file, the following table is an example of the layout.
| TaxonomicOrder | Species | SpeciesCode | Count | SpeciesCover | Date |
| 28600 | Bar-tailed Godwit | BA | 10 | Good | Sep-01 |
| 28600 | Bar-tailed Godwit | BA | 4234 | Good | Oct-01 |
| 28600 | Bar-tailed Godwit | BA | 76 | Good | Nov-01 |
| 28600 | Bar-tailed Godwit | BA | 33 | Poor | Dec-01 |
| 28600 | Bar-tailed Godwit | BA | 444 | Good | Jan-02 |
| 28600 | Bar-tailed Godwit | BA | 405 | Good | Feb-02 |
| 28600 | Bar-tailed Godwit | BA | 4556 | Good | Mar-02 |
| 14400 | Teal | T. | 0 | Good | Oct-01 |
| 14400 | Teal | T. | 43 | Good | Nov-01 |
| 14400 | Teal | T. | 36 | Good | Dec-01 |
Synopsis data
The following tables are an example of a Tabulated five-year synopsis output, which are provided in htm, pdf and rtf formats. Please note that the tables shown here have been cropped. Actual data outputs will provide data for all species recorded on the selected site during the selected years.
Table 1 provides information on the total waterbird community (all species combined) in each of the years summarized. Summing the counts of all species from each month and selecting the highest provides the “peak monthly total” and the month in which this occurred. Seasonal peak totals provide the highest count for each species in each season, averages for each season are also provided.
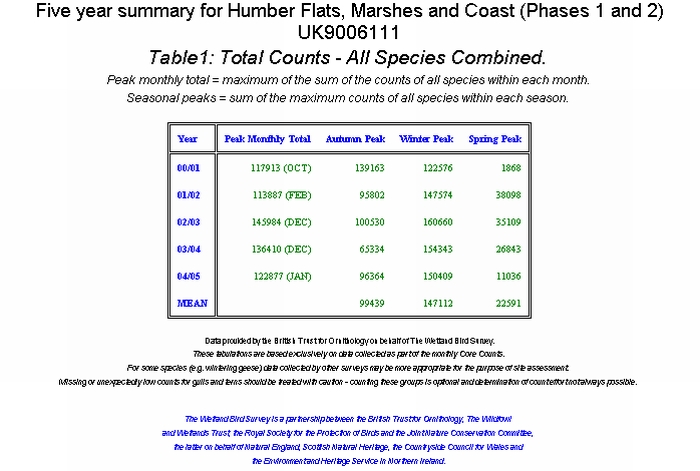
Table 2 provides average counts calculated across the included years are provided for each species. The number of complete/incomplete counts during the five years are given in parentheses.

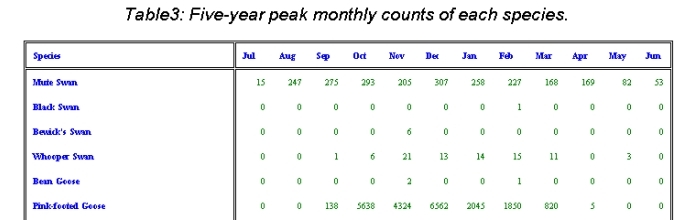
Table 3 provides the highest counts made over the included years are given for each. The number of complete/incomplete counts can be found from Table 2.
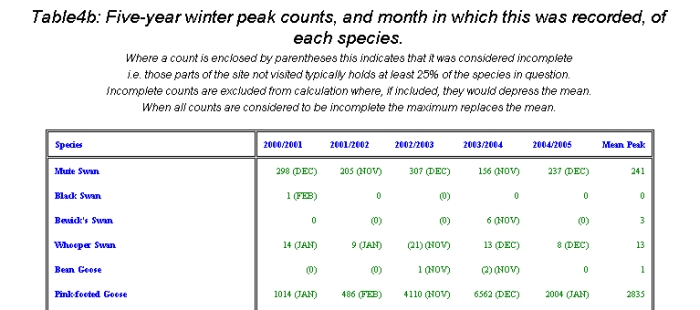
Tables 4 (in 3 parts) provide the peak seasonal count of each species in each of the included years, for Autumn (July to October inclusive), Winter (November to March inclusive) and Spring (April to June inclusive). The month of the peak is given in each case. Where tabulated values are enclosed in parentheses this indicates they are based on incomplete counts. Please note, only data for winter are shown here. Actual data outputs will provide data for seasons.
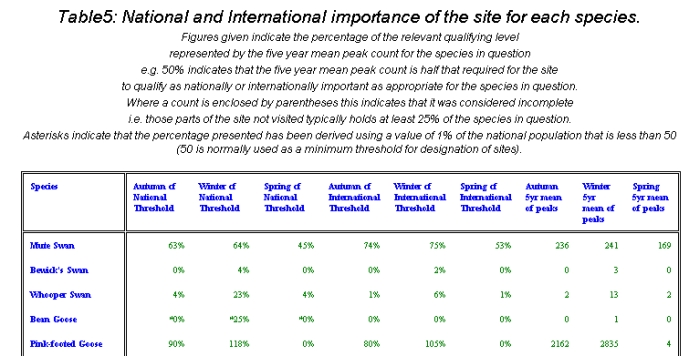
In Table 5, average peak season counts as tabulated in 4 (all three season) are compared to qualifying levels used to assess whether or not a site holds nationally or internationally important numbers of a given species. These qualifying levels are published in the Wetland Bird Survey Annual Report - Wildfowl and Wader Counts, published by BTO, WWT, RSPB & JNCC, and are updated at approximately nine-year intervals. The tabulated value is the percent of the relevant qualifying level that the mean peak count for the site represents. For some species (e.g. Ringed Plover) different qualifying levels are used for assessment of wintering and passage (spring & autumn) populations. For species for which qualifying levels have not been set (e.g. Common Sandpiper) N/A replaces the estimate of importance in the table. Where tabulated values are enclosed in parentheses this indicates that 1% of the British wintering population (the normal qualifying level criterion for British National importance) is less than 50 birds. In such cases 50 is used as the minimum qualifying level for British national importance.


Share this page