
Low Tide Data example
Low Tide Data are available as a synopsis for the whole winter and as dot density maps.
Table 1 gives the raw monthly totals for all species counted across the whole site.
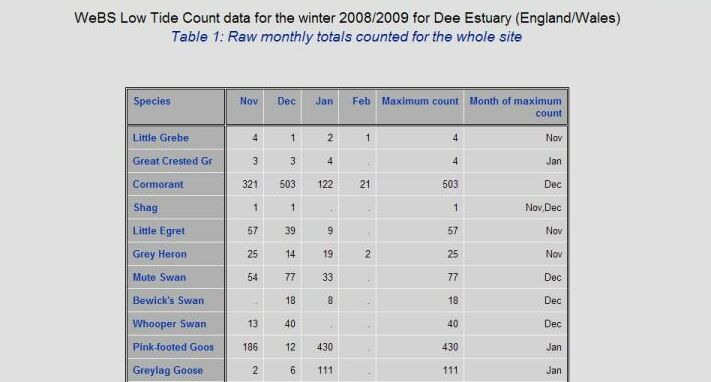
Table 2 gives the total area of each habitat type - Intertidal, subtidal and non-tidal present in each count section as calculated using ArcView GIS.
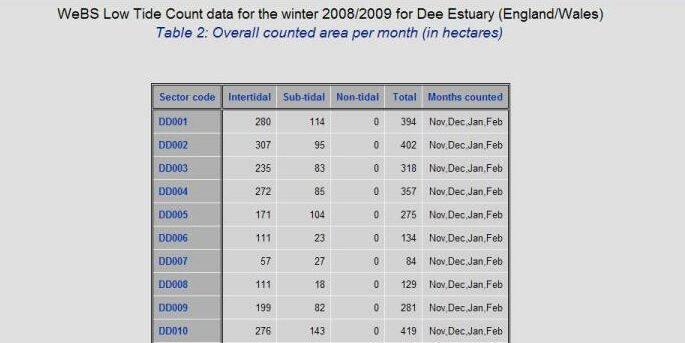
Table 3 gives the peak and mean counts on just the relevant sectors for which data was requested
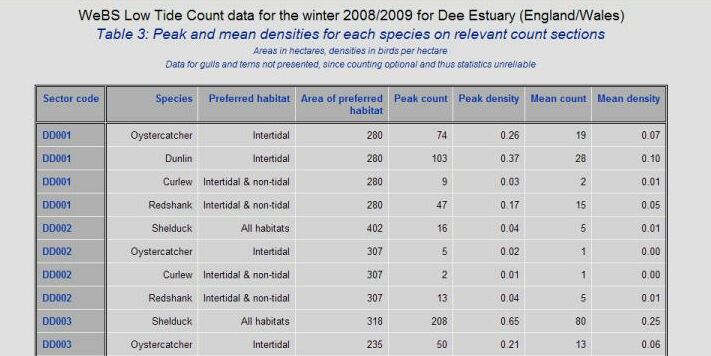
Table 4 gives the mean count and density for each species across the whole site.

Dot Density Maps
The production of maps depicting bird distribution has been a major theme from the beginning of the LTCs, with GIS technology providing great versatility in the range of presentational options available. These are available for all Low Tide sites for any species required that was recorded in that winter.


Share this page