Preliminary report on the 2017 breeding season
The primary aim of BTO surveys is to monitor changes in the health of Britain’s birds, tracking declines and increases via the BTO/JNCC/RSPB Breeding Bird Survey and exploring the factors driving them through bird ringing and nest recording. The long-term trends in abundance, survival and breeding success generated by these schemes are presented on the BirdTrends webpages.
This report provides a preliminary assessment of the 2017 breeding season in terms of population sizes and breeding success, comparing this year’s results to the averages recorded over the previous five seasons.
How do we monitor the breeding season?

in 2017 compared to the five-year mean.
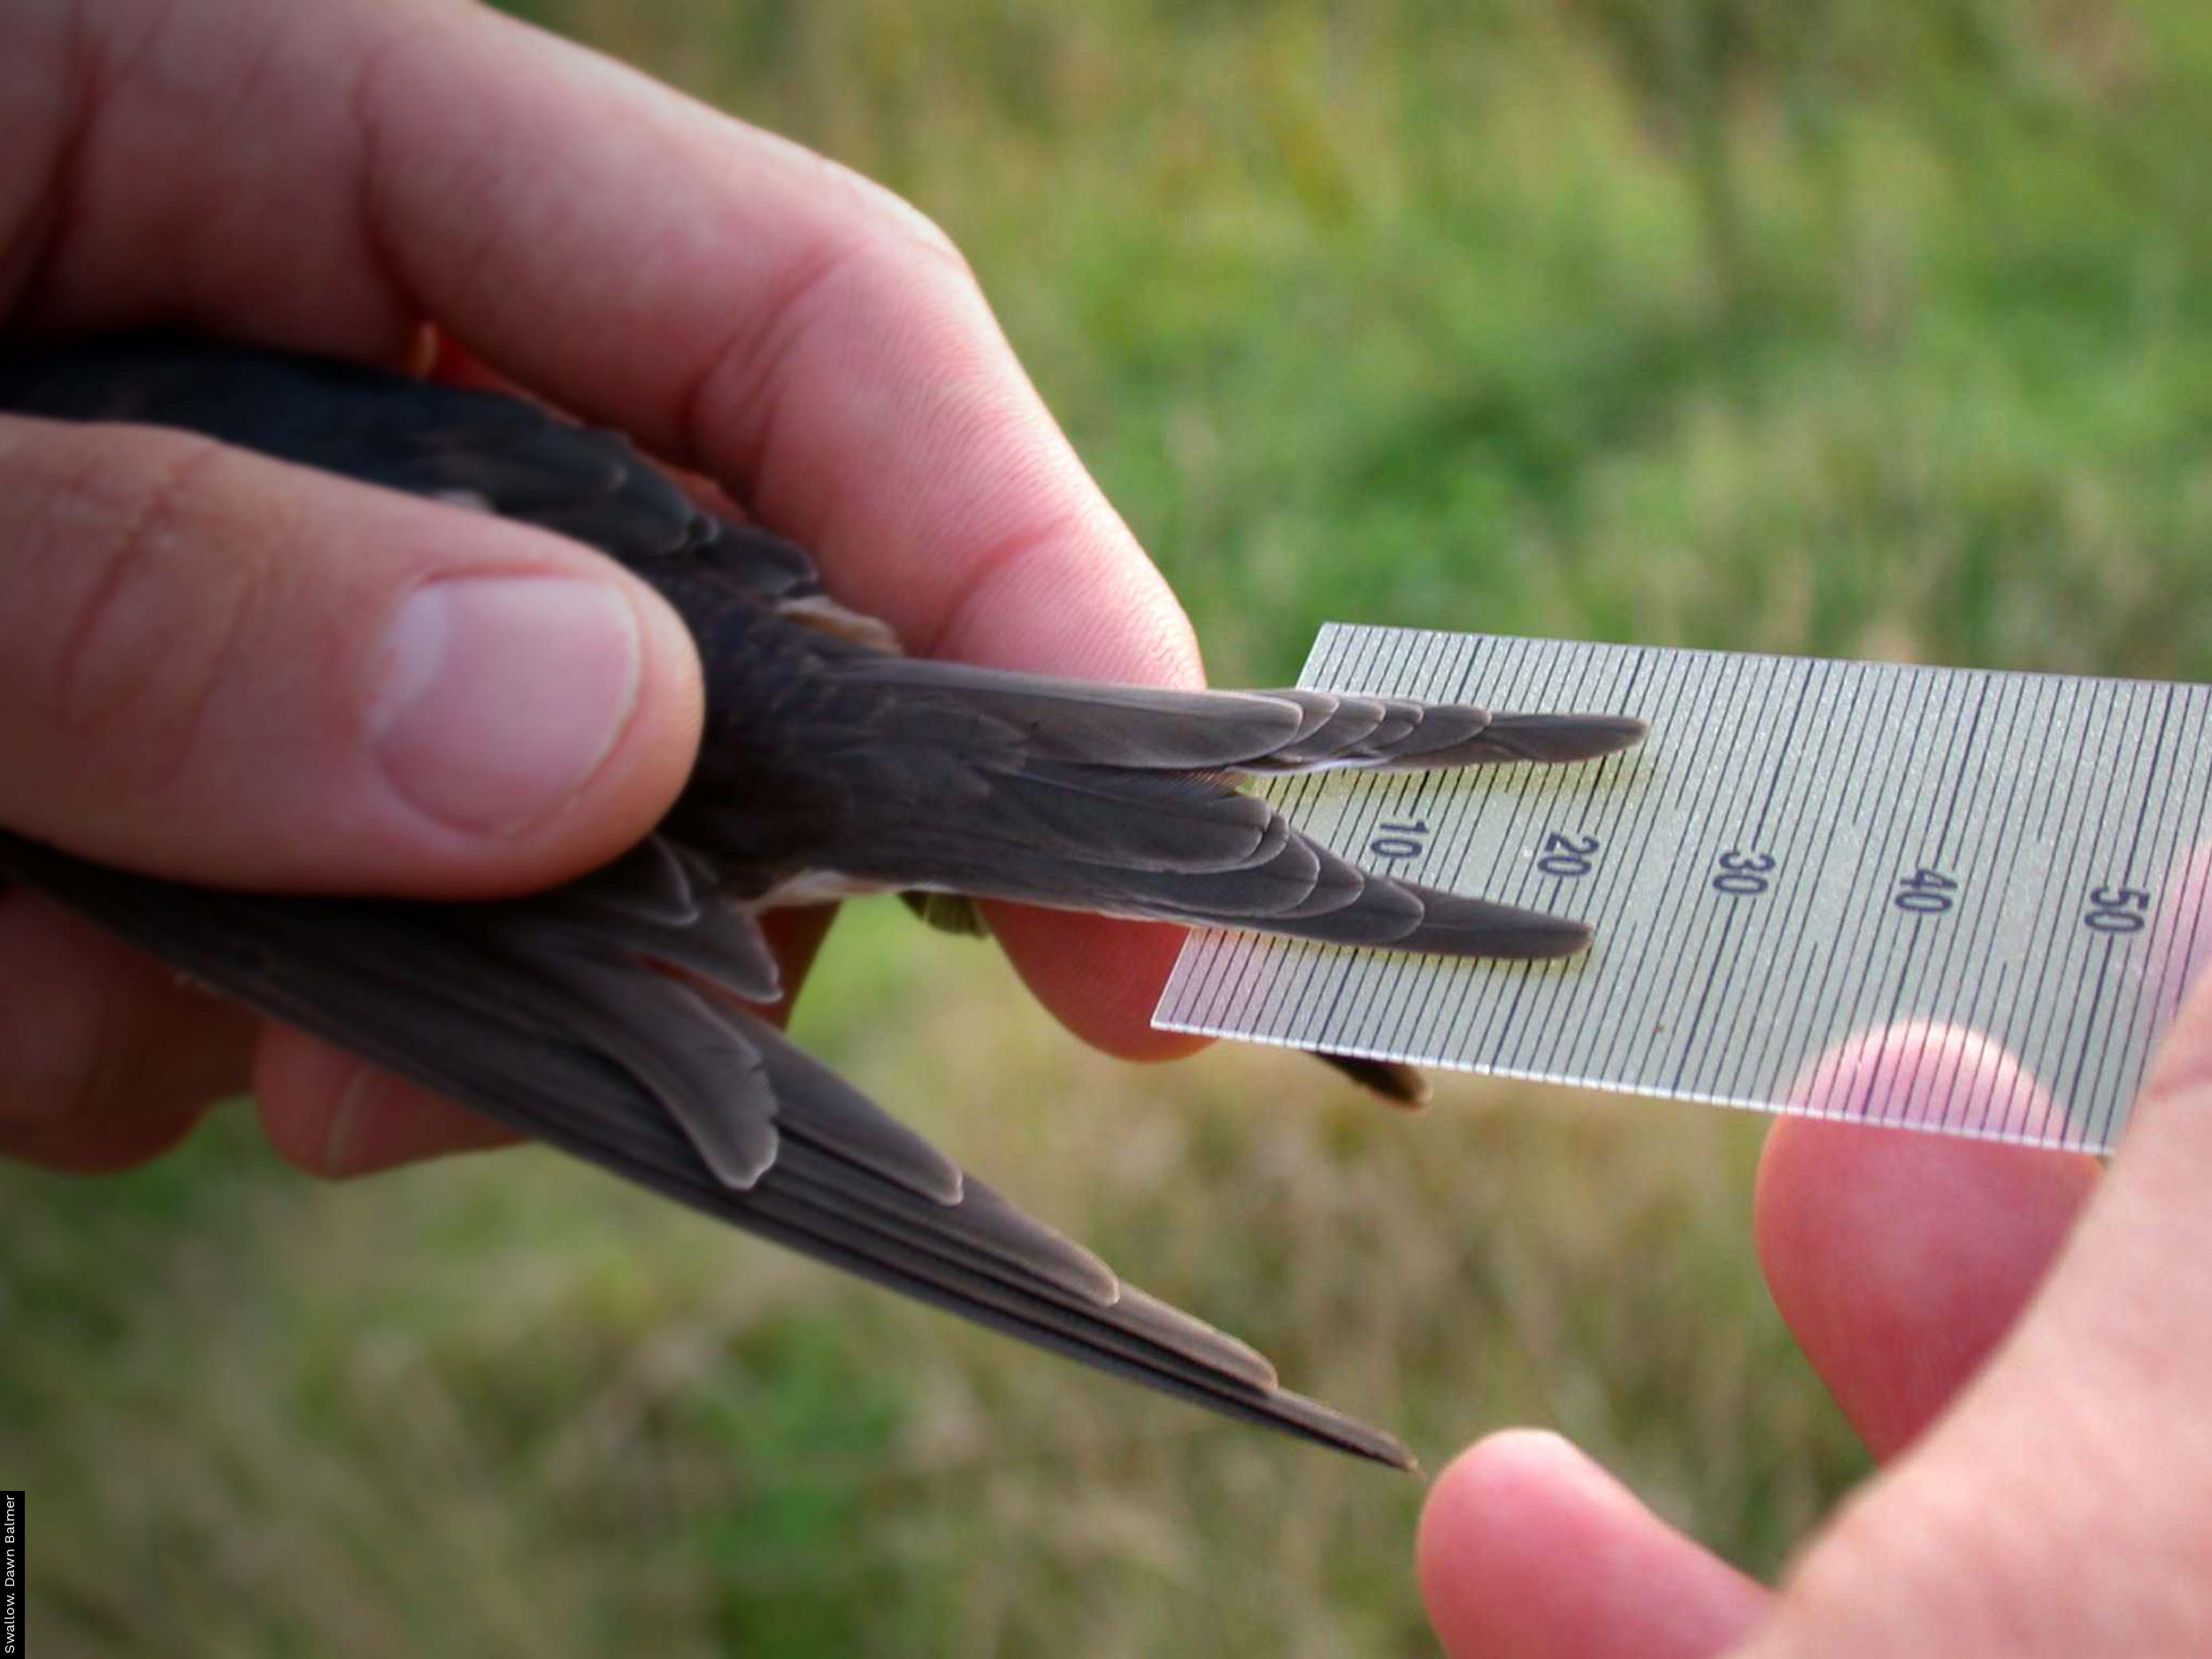
All of the data presented here are collected by BTO volunteer ringers and we are extremely grateful for their efforts, both in collecting the data and submitting it promptly. Numbers of adult birds are monitored by qualified bird ringers running a network of approximately 140 Constant Effort Sites (CES) across Britain & Ireland between May and August. As their effort is standardised annually, the number of birds caught in each year provides an accurate measure of changes in abundance. Recaptures of birds ringed in previous years also allow survival rates to be calculated. The ratio of juvenile to adult birds caught on CESs provides a measure of breeding success that also takes into account the number of successful breeding attempts made per adult (as many species attempt to rear more than one brood per season) and the survival of young birds immediately after fledging.
CES covers 24 woodland, scrub and reedbed species. Not all of the CES data collected in 2017 have been received yet, so these results are based on a subset of sites for which we currently hold sufficient data to analyse.
What was the weather like in 2017?
Winter 2016/17 was generally dry and mild, and relatively benign, until the second half of February when conditions turned stormy. All parts of the UK experienced drier than average conditions at some point over the winter (December 2016 in southern England and January in Scotland and western areas). March and early April were warmer than average, but there were numerous late frosts in the second half of April. April was also drier than average for most areas, except northwest Scotland, whilst May was generally warm and wetter than average in the southeast but dry in the north and west. Throughout the summer (June to August), rainfall totals were above average for the UK as a whole in every month and mean temperatures were at or above average throughout the summer. June 2017 was the equal fifth warmest and the sixth wettest June since records began in 1910; many places received twice their average rainfall that month.

Migrant ups and downs

increase in productivity in 2017.
Results from this year’s CES survey show that there were significantly higher numbers of adult Chiffchaff and Reed Warbler at the start of the season compared to the five year mean (2012–16). Numbers of Chiffchaffs were high in all regions except the west, while Reed Warbler numbers were particularly high in the north. For the second year running, more Chiffchaffs were recorded than in any year since the survey began in 1983. Survival rates for Chiffchaff and Reed Warbler were low in 2017, although only significantly so for Reed Warbler, suggesting overwinter survival of adult birds was not the driver of these increases. Although productivity for both species was significantly reduced in 2016, one possible cause of the increase is high overwinter survival of those juveniles that did manage to fledge last season.
Blackcap and Garden Warbler were the only migrants to exhibit a significant decrease in abundance compared to the five-year mean (particularly driven by results in the east and west of the country), with fewer Garden Warblers recorded in 2017 than in any previous year. Both species also exhibited low survival rates in 2017, although the reduction was only significant for Blackcap. Productivity was significantly reduced in 2016 for both species, suggesting the reduction in numbers could have been caused by a combination of poor adult overwinter survival and poor recruitment.
Table 1. Adult abundance and breeding success calculated from 2017 CES data. Figures represent a percentage change relative to the five-year average (2012–16), with lower and upper 95% Confidence Intervals given in brackets. Statistically significant (p < 0.05) positive and negative changes are highlighted in blue and red respectively. '*' denotes a small sample size.
|
Species |
Adult abundance change (%) |
Productivity change (%) |
||
|
Migrant warblers |
||||
|
Chiffchaff |
20.2 |
(12, 29) |
-6.5 |
(-14, 2) |
|
Willow Warbler |
2.1 |
(-6, 11) |
-16.0 |
(-25, -6) |
|
Blackcap |
-6.9 |
(-12, -1) |
25.5 |
(16, 36) |
|
Garden Warbler |
-20.5 |
(-30, -9) |
19.3 |
(-3, 46) |
|
Lesser Whitethroat |
-11.9 |
(-28, 8) |
-22.9 |
(-44, 7) |
|
Whitethroat |
-8.9 |
(-18, 1) |
4.2 |
(-8, 19) |
|
Sedge Warbler |
-3.5 |
(-11, 5) |
-0.6 |
(-11, 11) |
|
Reed Warbler |
6.0 |
(1, 11) |
-4.2 |
(-11, 3) |
|
Other residents |
||||
|
Cetti's Warbler |
9.9 |
(-11, 35) |
31.0 |
(-2, 74) |
|
Treecreeper |
33.5 |
(5, 69) |
-2.1 |
(-28, 33) |
|
Wren |
8.1 |
(-1, 17) |
-13.3 |
(-22, -4) |
|
Blackbird |
5.6 |
(-2, 14) |
-0.4 |
(-12, 12) |
|
Song Thrush |
2.3 |
(-10, 16) |
18.7 |
(-3, 45) |
|
Robin |
19.3 |
(9, 31) |
-11.5 |
(-21, -1) |
|
Dunnock |
1.5 |
(-7, 10) |
-0.6 |
(-11, 12) |
|
Chaffinch |
-46.0 |
(-54, -36) |
81.7 |
(44, 130) |
|
Greenfinch |
-54.3 |
(-65, -40) |
89.2 |
(29, 177) |
|
Goldfinch |
-4.9 |
(-20, 13) |
28.9 |
(-2, 70) |
|
Bullfinch |
14.4 |
(5, 25) |
15.4 |
(1, 32) |
|
Reed Bunting |
-7.3 |
(-18, 4) |
-10.7 |
(-28, 10) |
|
Resident tits |
||||
|
Blue Tit |
-13.1 |
(-20, -5) |
47.5 |
(33, 64) |
|
Great Tit |
-7.1 |
(-16, 3) |
30.7 |
(16, 48) |
|
Willow Tit |
-39.5 |
(-69, 19) |
36.1 |
(-41, 215) |
|
Long-tailed Tit |
3.3 |
(-7, 15) |
15.2 |
(0, 32) |
Another mixed year for residents

Despite poor productivity in 2016 for most residents, three species (Treecreeper, Robin, Bullfinch), recorded significant increases in abundance in 2017 compared to the five-year mean. Treecreepers were recorded in higher numbers than in any previous CES year; however, they also exhibited their lowest survival rate since CES began. Robin numbers were the second highest on record. The rise in Bullfinch numbers was driven by a significant increase in the north. Adult survival rates were low for all three species (significantly so for Robin) suggesting that the mild weather over the winter of 2016–17 enabled the juveniles that did fledge last year to survive in good numbers.
Three resident species exhibited a significant decrease in numbers in 2017, with Chaffinch (46%) and Greenfinch (54%) recording particularly large decreases; although still significant, the decrease in Blue Tits (13%) was less extreme. All three species recorded decreases across all regions except for the north, which saw a small (non-significant) increase in Blue Tit numbers. Both Chaffinch and Greenfinch were recorded in lower numbers than in any previous year. Significant decreases in productivity in 2016, coupled with significant decreases in survival for Chaffinch and Blue Tit, are likely to have contributed to the declines. Greenfinch had a disastrous breeding season in 2016, exhibiting the lowest productivity of any CES species (-63%); despite the survival rate in 2017 being positive (although not significantly so) it is likely that poor recruitment was a factor in the decline of this species. These results appear to be backed up by BirdTrack data, which also show a sharp reduction in the reporting rate for Greenfinch in 2017 compared to the historical trend.
West is best for breeding
As the results table (above) shows, nationally, seven of the 24 species monitored for CES exhibited statistically significant increases in productivity in 2017 compared to the five-year mean, while three showed a significant decline in productivity. Regionally, migrants fared poorly in the north but well in the west, while residents were more successful in the north and west. Some of the biggest winners in terms of productivity were Chaffinch, Greenfinch, Blue Tit and Blackcap, four of the five species that were recorded in low numbers in 2017; Chaffinch productivity is now at its highest point since CES began in 1983. It is possible that density dependence contributed to the breeding success of all three, with competition between individuals decreasing as numbers fall. Conversely, Robin, whose numbers were high this year, experienced a poor breeding season, driven mainly by results in the east of the country; it is possible that density dependence was again a factor, with competition for resources increasing as a result of the high number of individuals. Willow Warbler productivity also decreased in 2017 driven by results in the north and west; this was the only species to exhibit a decline in productivity in the west of the country.

Join us in monitoring birds in 2018
If you are a qualified ringer with access to an area of scrub, woodland or reedbed where there is the potential to catch at least 250 birds per season, why not register a CES? And if you aren’t able to start your own site, why not consider helping out at an existing one? Contact the CES Organiser for more information.
Acknowledgements
We are extremely grateful to all Constant Effort Site ringers for their monitoring efforts and for the support of the BTO/JNCC partnership, which the JNCC undertakes on behalf of the Country Agencies. Additional funding for the BTO Ringing Scheme is provided by The National Parks and Wildlife Service (Ireland) and the ringers themselves. The Breeding Bird Survey is run by the BTO and jointly funded by the BTO, the JNCC and the RSPB. BirdTrack is organised by the BTO for the BTO, RSPB, BirdWatch Ireland, SOC and WOS.


Share this page