Resources for ringers
Data collection and biometrics

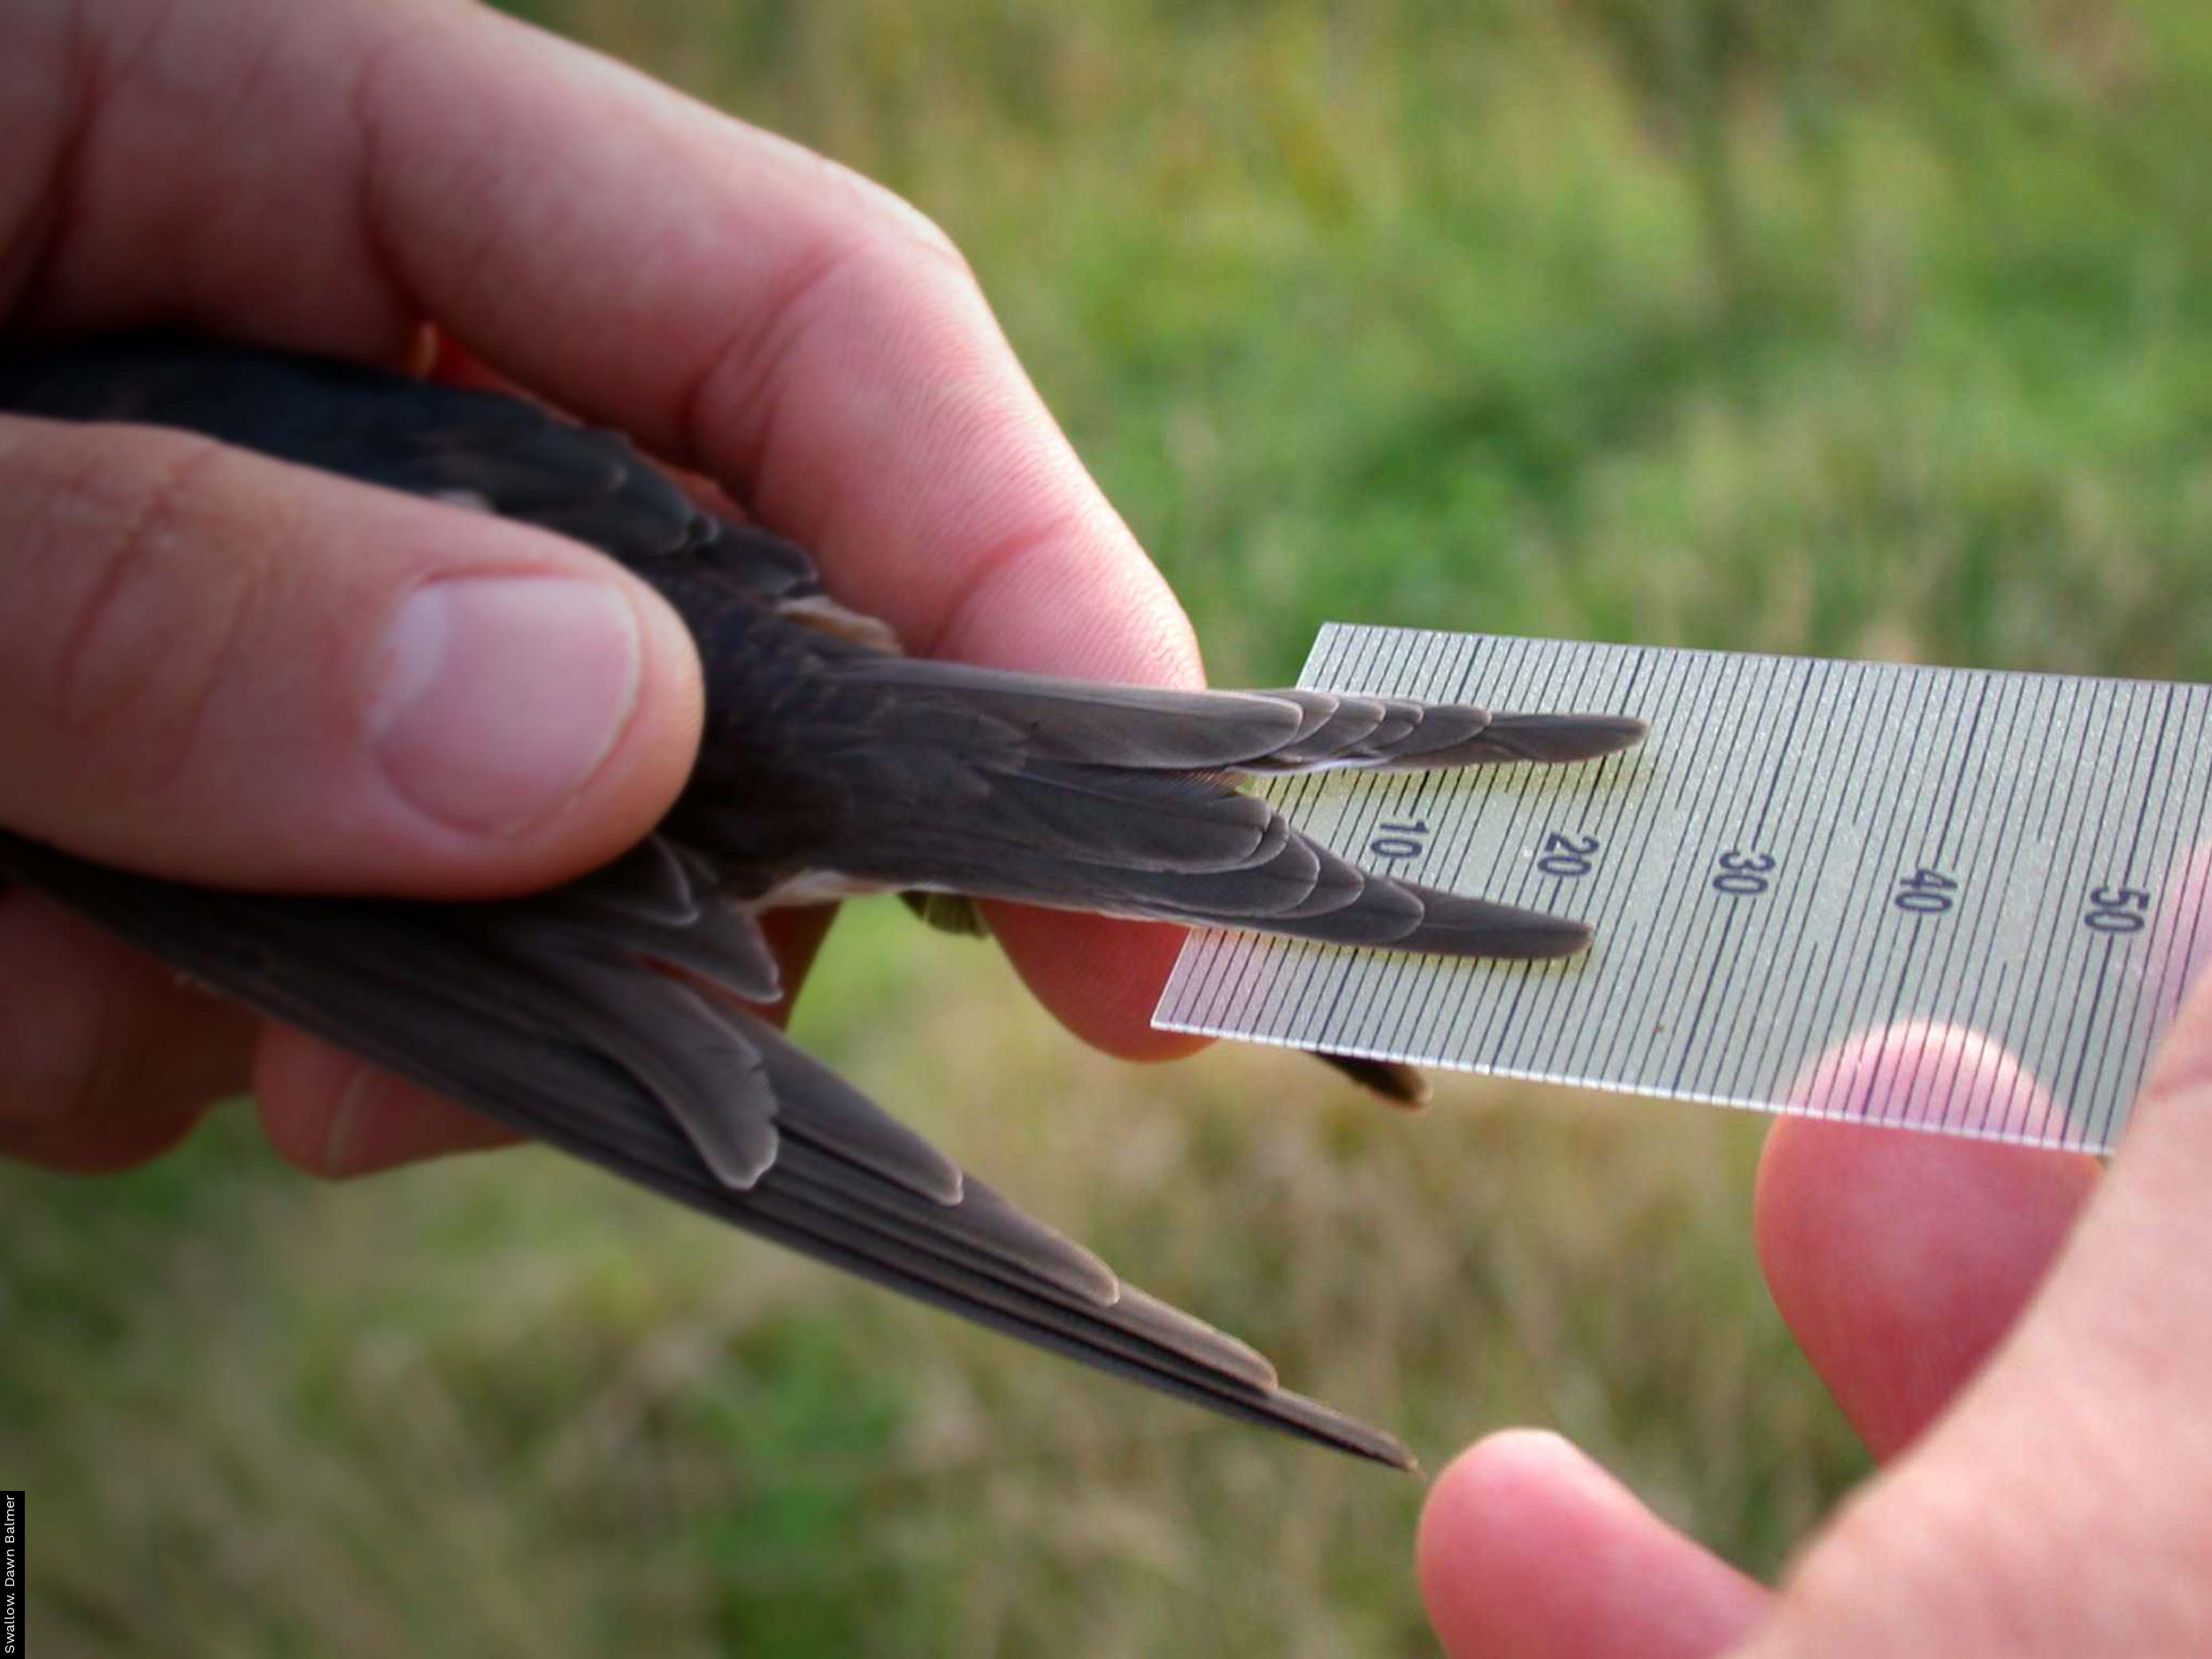
Information relating to collecting data and taking biometrics, including downloadable guides to help in the field, can be found in the Data collection and biometrics pages.
If you are giving a ringing related talk or organising a ringing demonstration or display, you will find helpful Powerpoint presentations as well as downloadable posters and leaflets in the Displays and Talks section.
Opportunities for ringers
If you are looking for additional ringing opportunities, when any are available, these will be posted on the Opportunities for ringers page.
Other ringing resources
Other useful documents, such as templates for site signage and an example letter requesting access to ring on a site can be found on the Other ringing resources page.
Additional resources are below:
Health & Safety
BTO has produced general guidance relating to health safety for all BTO fieldworkers. This page includes information on access permissions, visiting nests, diseases and working in remote areas.
Posting on social media?
Social media is a useful way to increase engagement with ringing and nest monitoring activities, promoting the valuable contribution that these studies make to our understanding of why bird populations change. It can, however, be a volatile environment, so we have developed some guidance, which we hope you will find useful.
The resources pages will be updated regularly as we develop new content. Don’t forget that the ringers-only pages of the website also contain lots of useful information and resources. Over time, these two sets of pages will be combined.
Buying rings and other ringing equipment
- Please visit the BTO Ringing Sales Shop to purchase all rings and other ringing equipment.


Share this page