Sustainability and citizen science: estimating the carbon footprint of the Breeding Bird Survey
BTO Data Scientist Simon Gillings explores the results of BTO's investigation into the carbon footprint of biodiversity monitoring.
Simon works with colleagues across BTO to provide strategic leadership, and analytical and design input, into the development of data products for internal and external audiences. In parallel, he leads the development of tools for acoustic monitoring of birds.
Relates to projects
Related Publications
Spring 2022 is well underway, with warblers in full song and the first Swifts spreading across the country. Just a few weeks ago I made the early season visit to my BTO/JNCC/RSPB Breeding Bird Survey (BBS) square.
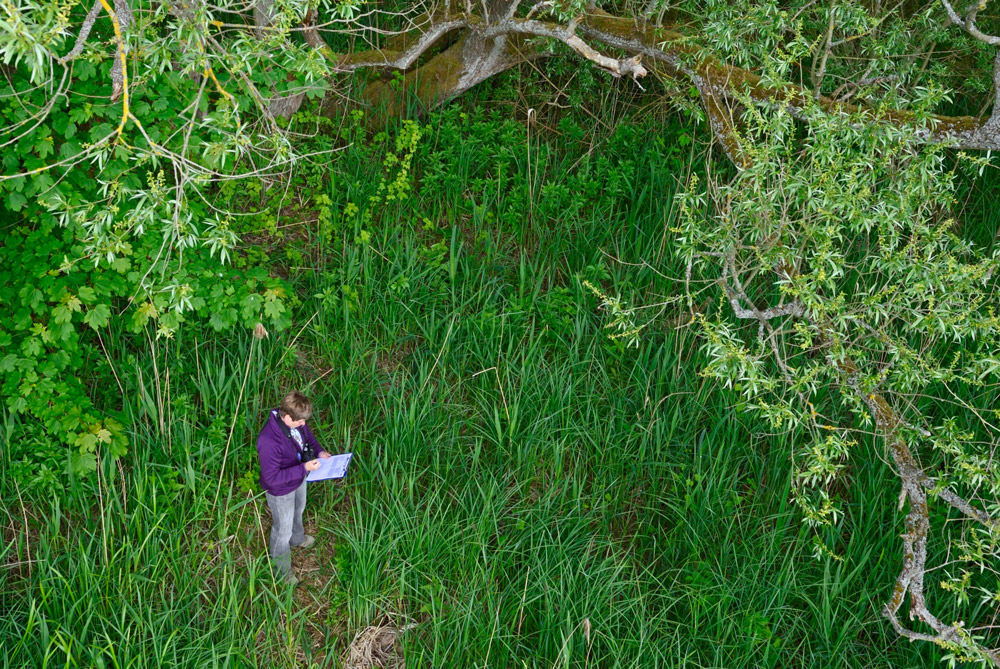
My square is 19 miles from home and like every previous year, I drove there. I saw 40 bird species, three mammal species and recorded habitat along the transects. My single Corn Bunting record will contribute to producing a vital population trend for Corn Buntings in eastern England. It was a lovely morning to be out and it felt good to do my little bit for bird monitoring.
We often talk about these counts being the ‘raw data’, but it’s not much of a stretch to say that my data, along with those of my fellow survey participants are the ‘raw materials’ from which BTO’s research ecologists produce population trends, which are then used by the conservation sector and provide the UK government with official statistics. These data are widely used for ecological research, such as assessing causes of decline, the impacts of environmental change and monitoring the success of management. So BTO’s ‘supply chain’ could be its network of skilled volunteers who collect the raw data, and - like many other forward-thinking organisations - BTO and its partners are investigating how the decisions we make affect the sustainability of these networks.
BTO research has identified that travel is a major barrier to younger audiences... to what extent is having a car a prerequisite for doing a bird survey?
Sustainable data
Sustainability is a broad subject. It includes making sure the survey schemes themselves can continue into the future, by securing stable funding, recruiting and training enthusiastic volunteers for tomorrow, and retaining skilled staff versed in the latest analytical methods. More often though we think of sustainability in environmental terms. Recently, I began investigating an aspect of sustainability that relates to both scheme longevity and the environment: survey-related travel. Two things led me to look into this.
Firstly, BTO research examining the barriers to survey participation has identified that travel is a major barrier to younger audiences. We also know that car ownership varies widely across society, raising the question: to what extent is having a car a prerequisite for doing a bird survey? Secondly, if most people have to drive to access their survey squares, what is the cumulative carbon footprint across the visits needed for a typical bird survey?
This may seem like a strange question: my 19-mile trips to my BBS square are an inconsequential fraction of my annual mileage. But remembering the supply chain analogy from earlier, companies are increasingly expected to measure and report the carbon emissions of their businesses. This means not just reporting the emissions associated with the electricity and heating at business premises but also, crucially, estimating those that arise in the production of the raw materials on which the business relies. For BTO that means emissions produced in the pursuit of data.
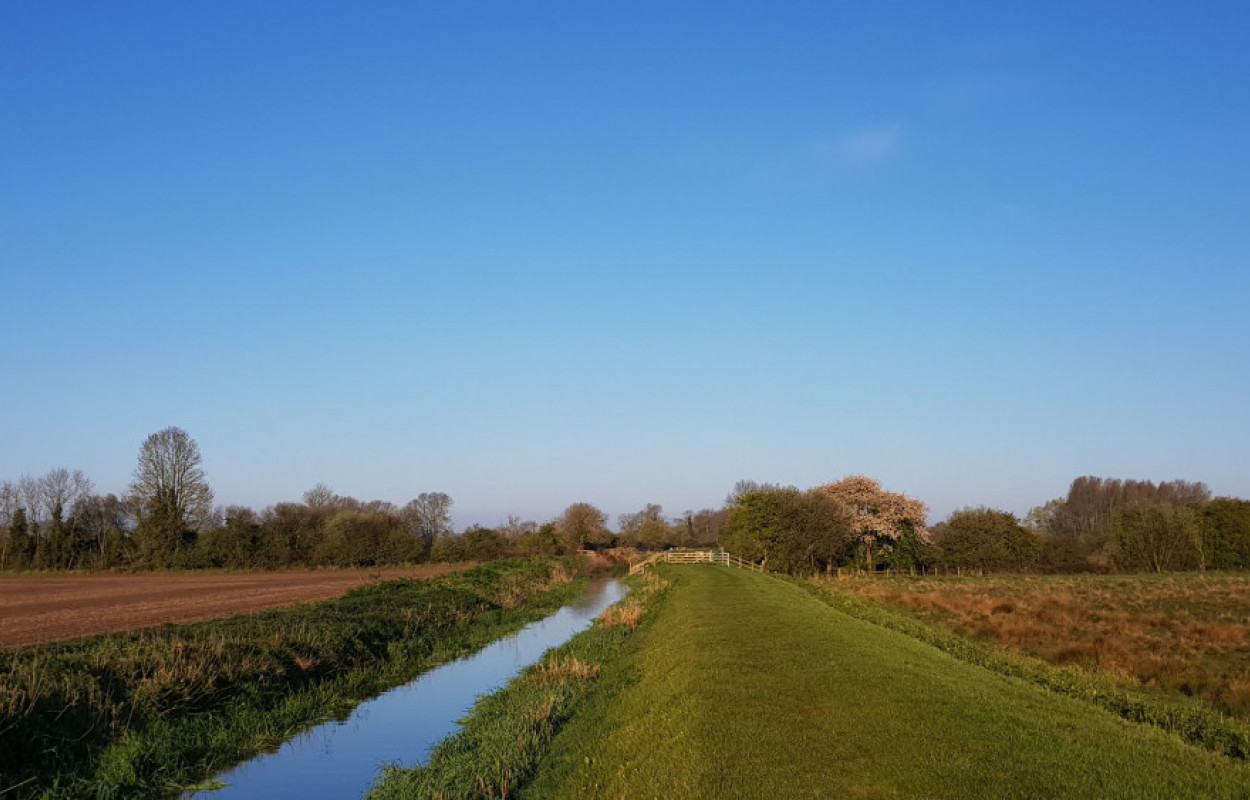
The Breeding Bird Survey is an ideal case study because of its survey design.
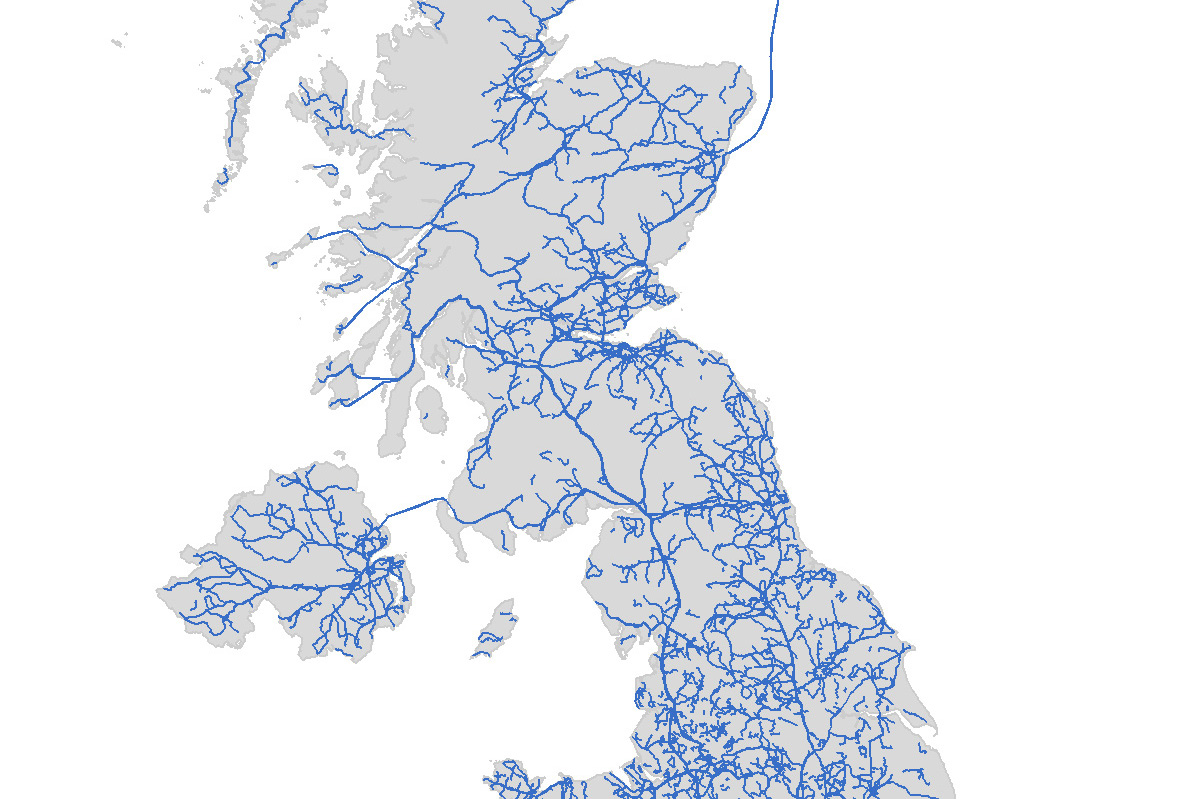
To answer these questions I used the 2019 BTO/JNCC/RSPB Breeding Bird Survey (BBS) season as a case study. BBS is ideal because of certain attributes of its survey design: whilst random survey squares and early morning visits make the data more robust, they could also lead to more travel to get to distant squares at antisocial hours. BBS is also a survey with lots of data from across the UK - in 2019, 2,765 volunteers made 7,520 visits to survey 3,914 1-km squares - and this provides ample opportunity to look at travel in areas with differing distributions of people and squares.
Exploring BBS accessibility and sustainability
We sent a questionnaire to all BBS participants to find out what transport volunteers used to travel to their survey squares, and where the trip started from. We also asked for additional information such as whether the visit was purely for the purpose of surveying.
Just over half of volunteers responded, confirming that the vast majority of visits - 89% - were conducted by private car, with 95% of these being petrol or diesel powered. Active travel by foot, bike or e-bike accounted for 10% of visits, and only 1.4% of visits were made by public transport.
These figures are not at all surprising: we ask volunteers to go to random squares, often in the middle of nowhere, to places not serviced by public transport (or at least not at the time of day we need to get there!). However, they do raise concerns; with nine out of ten BBS squares requiring access to a car, and with car ownership being lower in some sectors of society, surveys like BBS aren’t equally accessible to all. This is a problem now, because it limits the diversity of audiences able to participate, and may become an issue for scheme longevity if car ownership reduces in the future.
Next, I used Google Maps to determine the approximate route that each volunteer would probably have taken to and from their square. Although a few participants live in the square they survey, most have to travel.
The longest round trip was 1,300 miles, but this related to one of the ‘Upland Rovers’ squares which was done whilst a volunteer was on holiday in Scotland. For the 125 Upland Rovers squares, it is difficult to separate the holiday travel from the survey travel, so I put those to one side for now and focussed on the remaining core squares. For these, the average travel distance was 14 miles, and overall I estimated that volunteers travelled about 177,700 miles to complete their visits.
Estimating carbon emissions from the BBS
Armed with the mode of travel for each visit, the length of each trip, and standard figures for the average amount of carbon emitted by different modes of travel, I estimated that surveying all the core BBS squares in 2019 incurred emissions of about 47 tonnes of CO2. In some respects this is a tiny figure - it accounts for just 0.00001% of total emissions in the UK in the same year, or the equivalent of the combined annual emissions of 4 or 5 UK adults.
But from the perspective of BTO, and the wider sustainability of our operations, it is significant. This figure is about 33% greater than all land-based business travel by BTO staff from April 2019 to April 2020. Remember, this is just one BTO survey: across the spectrum of BTO monitoring schemes, we may be talking about several hundred tonnes of carbon emissions. And if we think broader still, to schemes for other wildlife, or in other countries, it is clear that biodiversity monitoring has a significant carbon footprint.
The significance of these results is in making the connection between our decisions as scientists and scheme organisers designing surveys, and the unintended consequences for survey accessibility, carbon emissions and the climate.
Join the discussion
We'd love to hear
from you!
Leave your comments
below.
Striking a balance
To be absolutely clear, I am not being critical of the travel choices of BTO volunteers. I and my colleagues at BTO are absolutely reliant on what volunteers do for BTO and wider ornithology in the UK and are hugely grateful. Instead, I think the significance of these results is in making the connection between our decisions as scientists and scheme organisers designing surveys, and the unintended consequences for survey accessibility, carbon emissions and the climate.
We have a very difficult balance to achieve. On the one hand, we need to gather critical information on biodiversity to assess how it responds to environmental change, and to test whether management policies aimed at helping biodiversity actually work. But on the other hand, we need to be mindful that increases in coverage, or rolling out new surveys, will likely lead to more carbon emissions.
I don’t know how we balance these two things. For instance, do we exercise restraint when planning the next national Bird Atlas? Or do we decide that the information it will provide is too important to cut corners in survey design? Either way, I think it is vital that we are open and honest about the impacts of our decisions and activities: acknowledging and measuring the scale of travel and emissions is the first step.
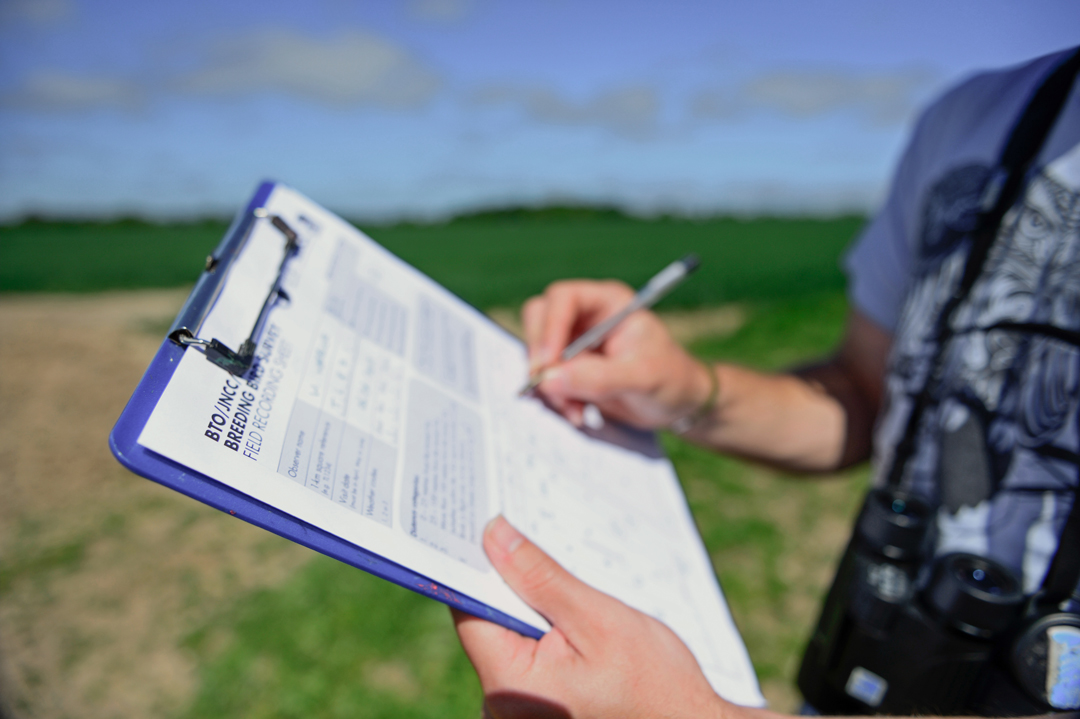
Estimating the carbon footprint of citizen science biodiversity monitoring
The carbon footprint of biodiversity monitoring
People & Nature
Whilst it is essential that we have accurate information about how wildlife is faring in this changing world, we also need to be mindful of the carbon footprint generated by monitoring activities.
More Details



Share this page