
Case studies
Case Studies - what have atlases told us?
Bird atlas data have been put to a wealth of uses. The references page lists a selection of the academic publications that have stemmed from atlas data, and there have been many other applications in environmental impact assessment and conservation projects. Below are 4 example case studies of the use of atlas data.
Farmland bird declines
Climate change
Macroecology
Birds of Conservation Concern
Farmland bird declines
In 1995, following the completion of the second breeding bird atlas (1988-91) Rob Fuller et al. published a paper in the journal Conservation Biology (1995,9:1425-1441) that demonstrated major range contractions for a host of farmland specialists. They drew together comparisons of the breeding range during the 1970s and 1990s from the two breeding atlases with population trend data from the Common Bird Census to assess the status of farmland birds. They showed that of 29 farmland species, 24 contracted in range between 1970 and 1990. When compared with other groups (e.g. wetland species, or woodland species) the farmland range contractions really stood out. Below are just two of the maps showing the staggering area over which some of Britain and Ireland's formerly common farmland birds had been lost from. These were some of the results that really raised farmland birds onto the conservation agenda and lead to considerable research into the causes of the declines by BTO (read more) and others.
Twenty years on we are keen to know if these worrying trends have continued or whether recent attempts to design effective agri-environment schemes have started to have an effect.
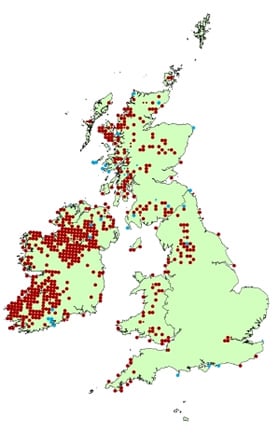
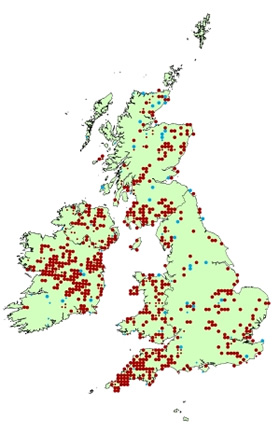
These maps show changes in range between the 1970s and 1990s atlases. Red dots indicate squares where the species was lost and blue dots indicate squares where the species was gained.
Climate Change

Climate change has hit the headlines and increasingly biologists are finding evidence of its impacts on wildlife. Already BTO data have shown that several bird species are nesting earlier (read more here) and BTO atlas data played a role in showing how distributions have changed, perhaps in response to climate change. Thomas and Lennon (1999: Nature 399: 213) looked at the northern and southern range limits of species distributions in Great Britain as determined by the 1968-72 and 1988-91 atlases. They classified the breeding birds of Britain into two groups, either southern breeders or northern breeders. Accepting that the range edges might expand or contract if a species is naturallyincreasing or decreasing, they were interested in whether the edges of the range moved when a species was otherwise stable. They found that the northern edge of southern species shifted north on average by about 18-19km. In contrast there was no systematic change in the southern edge of range for northern species. These results were consistent with those found for butterflies in which northern range boundaries have expanded more than southern boundaries have retracted.
With some of the warmest summers and mildest winters on record having occurred since the last atlases, which species will have gained and will there be contrasting losses when we compare the Bird Atlas 2007-11 results with earlier atlases?
Macroecology
Macroecology can be defined as the study of relationships between organisms and their environment at large spatial scales to characterise and explain statistical patterns of abundance, distribution and diversity. It is immediately obvious from their scale of coverage that atlases can play a major role in the study of macroecology and Britain and Ireland's birds have featured heavily in the macroecology literature. One such example is the study of Gaston and Blackburn (2002, Journal of Animal Ecology 71: 390-399) in which they use the two breeding bird atlases to assess the rates of gains and losses and how they were related to factors such as body size, overall range size, abundance and dispersal ability. They aimed to test various theories, for instance that species that occur at low levels of abundance may be subject to high rates of local extinction (losses in the atlas sense) whereas those with high rates of dispersal may be expected to show low rates of local extinction.
They found that species with small ranges and high rates of dispersal were more likely to have colonized new areas between 1970 and 1990. Acting in the opposite direction, species with small population size and low body size were more likely to have disappeared from areas between 1970 and 1990. The authors contend that these results suggest that long-term evolutionary history has influenced the ability of species to respond to current ecological conditions. Understanding such processes takes on an applied importance when the issue of colonisation/extinction is applied to farmland birds. Understanding the importance of dispersal ability for instance may help in determining how to go about providing seed-rich habitats or supplementary food to help farmland bird populations recover.
Birds of Conservation Concern / The Population Status of the UK's birds

The leading governmental and non-governmental conservation organisations in the UK have reviewed the population status of 247 bird species that are regularly found here and classify them into one of three lists - red, amber or green. The classification is based on population size, range size and temporal trends in either. Atlas data were used for range size information and clearly Bird Atlas 2007-11 presents an opportunity to revisit range size issues. Currently 40 species are red-listed, 121 are amber-listed and 86 are green-listed. To read more about these lists click here.


Share this page